What is this?

This knowledgebase contains questions and answers about PRTG Network Monitor and network monitoring in general.

Learn more

PRTG Network Monitor

Intuitive to Use. Easy to manage.
More than 500,000 users rely on Paessler PRTG every day. Find out how you can reduce cost, increase QoS and ease planning, as well.

Free Download

Top Tags


View all Tags

How can I display limits in graphs with PRTG?

Votes:

0

I would like to draw a horizontal line in graphs to indicate a limit, or have some similar indicator to see immediately when a pre-defined limit is breached.

How can I achieve this?

channel chart graph limit prtg settings

Created on Mar 4, 2013 9:24:10 AM by  Gerald Schoch [Paessler Support]


4 Replies

Accepted Answer

Votes:

0

This article applies to PRTG Network Monitor 13.1.3 or later

Set Limit Markers in Graphs

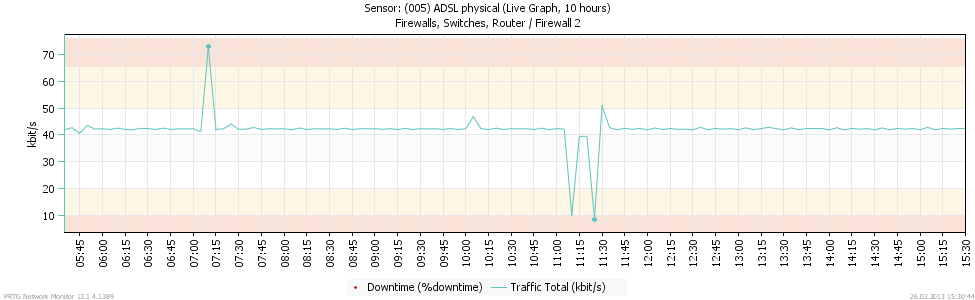
PRTG’s graphs will automatically display limits you set in the sensor channel settings. You can set upper/lower error and/or warning limits. Limits will automatically set a sensor into Warning and/or Down status. Each limit will automatically be shown as a yellow or red area in a sensor graph if you configure the graph to show one sensor channel only.


Sensor Channel LimitColor of Area in Graph
Upper Error Limitred
Upper Warning Limityellow
Lower Warning Limityellow
Lower Error Limitred


For example, a traffic graph with limits can look like the following:
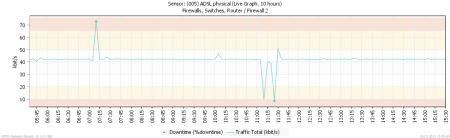
Click here to zoom


Configuration Step-by-Step

In order to create a graph display like this, please ensure the following:

  1. In the sensor channel settings, in the Display section, set the option Hide from graphs for all sensor channels except for one—the one you want to have a graph with limits for.
  2. For the remaining sensor channel, in the Limits section, Enable Limits and set error and/or warning limits. Save your settings.
  3. Return to the sensor’s Overview tab to check the graph display. In order to get a filled graph, set the remaining sensor channel as Primary channel for this sensor. All other sensor channels will be displayed as a line only.

Other alternative(s):

For "visual markers" only (A limit which doesn't affect the sensor's status) you may employ a Sensor Factory Sensor.

Created on Mar 4, 2013 9:38:28 AM by  Gerald Schoch [Paessler Support]

Last change on Jan 15, 2019 1:56:21 PM by  Andreas Günther [Paessler Support]


Votes:

0

Hi, is this still a valid article? I'm having a hard time finding the Limits settings in a bandwidth sensor using SNMP v2. PRTG version is 18.4.

Thanks!

Created on Jan 10, 2019 6:43:41 PM


Votes:

0

Is this still possible in 19.2.50? I cannot seem to find a way, to get limit lines on our graphs. I am using a custom snmp sensor.

Created on Jun 24, 2019 3:54:11 PM


Votes:

0

Hi there,

This is still working. You should see the red and yellow area in the graphs.

Is it possible that your limit is far above the current value? This would mean that the error limit area is out of the view of the graph.

Best regards.

Created on Jun 25, 2019 9:07:33 AM by  Dariusz Gorka [Paessler Support]


Disclaimer: The information in the Paessler Knowledge Base comes without warranty of any kind. Use at your own risk. Before applying any instructions please exercise proper system administrator housekeeping. You must make sure that a proper backup of all your data is available.