What is this?

This knowledgebase contains questions and answers about PRTG Network Monitor and network monitoring in general.

Learn more

PRTG Network Monitor

Intuitive to Use. Easy to manage.
More than 500,000 users rely on Paessler PRTG every day. Find out how you can reduce cost, increase QoS and ease planning, as well.

Free Download

Top Tags


View all Tags

How can I change the PRTG version string shown in the graphs of PRTG?

Votes:

0

I would like to change the default string that is shown in the lower left corner of every graph shown in the PRTG web interface and the Windows GUI. Instead of the PRTG version, I would like to print my own text there.

How can I do this?

graphs prtg registry text

Created on Nov 4, 2010 11:24:09 AM by  Daniel Zobel [Product Manager]

Last change on Nov 15, 2011 10:42:58 AM by  Daniel Zobel [Product Manager]


13 Replies

Accepted Answer

Votes:

1

This article applies to PRTG Network Monitor 8.1.2 or later

Change PRTG Version Text in Graphs

By default, PRTG shows its name and version number in a small text line underneath each graph. You can change this text by adding a new value to the Windows registry.
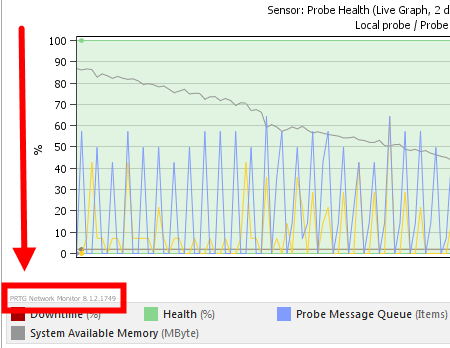

Graph in PRTG Web Interface Show image in full size


Caution: Please backup your system before manipulating the Windows registry!

Step 1

  • On the system running the PRTG core server, open the registry editor.
  • For a 64-Bit Windows system, go to HKEY_LOCAL_MACHINE\SOFTWARE\Wow6432Node\Paessler\PRTG Network Monitor\Server\Webserver\
  • For a 32-Bit Windows system, go to HKEY_LOCAL_MACHINE\SOFTWARE\Paessler\PRTG Network Monitor\Server\Webserver\

Note: For PRTG 8 you might see the values in the additional sub-key V7 or V8.

Step 2

  • Add a new String with the name GraphExtraText.
  • As value, set the text you want to appear underneath the graphs. If you want to show nothing in the lower left corner of your graphs, please enter three spaces " ".

Notes

  • The new setting is active after a restart of the core server Windows service (see PRTG System Administrator in manual).
  • To reset the text to default (PRTG name and version number), please delete the string from the registry, or set its value to an empty string.
  • Since PRTG version 8.2.0.1875, this setting is also valid when using the Windows GUI.
  • The setting is only valid for the core server on which you've just changed the registry. When running a cluster with additional core server installations, please perform these steps on every node to make sure the changed text is visible to users regardless of the node they connect to.

Created on Nov 4, 2010 11:43:20 AM by  Daniel Zobel [Product Manager]

Last change on Nov 15, 2011 10:41:57 AM by  Daniel Zobel [Product Manager]


Votes:

0

I'm trying to eliminate this string at the bottom of MAPS. Is this possible? All my maps have a string such as the following at the bottom:

Network Monitor 9.2.1.2308, Network Monitoring Software (c) 2012 Paessler AG ...

Created on May 31, 2012 10:04:00 PM


Votes:

0

That's very likely the mapshot.htm/pagefooter.htm there, not the registry key explained in this article.

Created on Jun 1, 2012 2:27:08 PM by  Torsten Lindner [Paessler Support]


Votes:

0

Is it also possible to change the graph footer that shows in the Enterprise Console?

Created on Feb 23, 2017 2:41:37 PM


Votes:

0

This should also apply to the EC as it uses the same graphs as the webinterface. Did you already add the regkey?

Created on Feb 23, 2017 2:56:08 PM by  Stephan Linke [Paessler Support]


Votes:

0

Hi Stephan,

Yes we have a group policy to set the reg. key for all or core servers and the graphs on the web GUI show our custom foot. Enterprise Console shows the default PRTG graph footer.

Created on Feb 23, 2017 4:54:37 PM


Votes:

0

Can't confirm - did you try to remove the connection and add it again? The string is also visible in the EC, since it's actually using the same graph images as the webinterface :)

Created on Feb 24, 2017 2:49:40 PM by  Stephan Linke [Paessler Support]


Votes:

0

Yeah, we've had it in place for a long time now and new clusters are picking it up. I assumed it would be the same as the graphs are from the same source... So when it didn't show I just assumed it would pick it up from a reg key on the local machine?

Created on Feb 24, 2017 3:12:53 PM


Votes:

0

Reghacks are not distributed to failover nodes. Can you check if the key is in place on all servers and restart the core server service, just to make sure it's read?

Created on Feb 24, 2017 3:27:49 PM by  Stephan Linke [Paessler Support]


Votes:

0

The GPO put the reg key on all PRTG servers including failovers. I can confirm it's in place on all of them. We've had that key in place for at least a year and servers have been restarted many times and some are new. We have only just started using the EC now all our clusters are on the same version.

Created on Feb 24, 2017 3:48:53 PM


Votes:

0

Can you check the graphs within the webinterface of the failover nodes - are they displayed correctly?

Created on Feb 27, 2017 9:37:36 AM by  Stephan Linke [Paessler Support]


Votes:

0

I know it's been a while since I last replied to this one. All master and failover nodes have the graph footer but I've never been able to get it to show in the EC.

Created on Oct 10, 2017 10:57:00 AM


Votes:

0

Could you post a screenshot of the EC graphs? It should be there, but it looks blurred due to scaling.


Kind regards,
Stephan Linke, Tech Support Team

Created on Oct 11, 2017 12:58:52 PM by  Stephan Linke [Paessler Support]


Disclaimer: The information in the Paessler Knowledge Base comes without warranty of any kind. Use at your own risk. Before applying any instructions please exercise proper system administrator housekeeping. You must make sure that a proper backup of all your data is available.