Note: This post is based on information submitted by our Knowledge Base user "Dean". Thanks, Dean!
Creating a WMI Custom Sensor Without Scripting Knowledge
Our query will take the form:
SELECT [Property] FROM [Class] WHERE Name='[Instance]'
Now we just have to figure out what Property, Class and Instance is. This is easier than you think. In terms of Windows Performance Monitor Property=Counter, Class=Object and Instance=Instance. Or, in the PerfMon GUI language:
SELECT [Counter] FROM [Object] WHERE Name='[Instance]'
Use a Tool
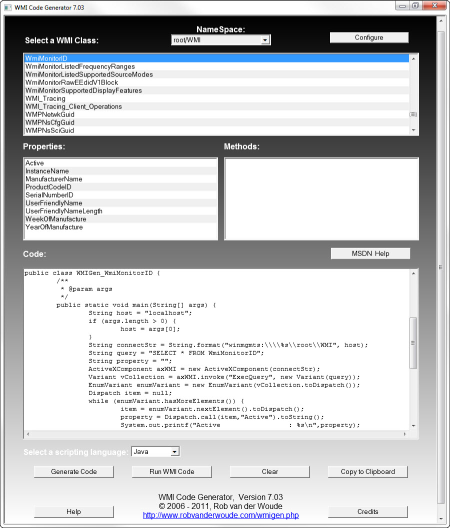
There is a nice little tool for that called WMI Explorer. Once you see the list of Classes and Objects you'll immediately recognize the corresponding Perfmon counters and Objects.
For example, to monitor the Averge Delivery Time to local mailboxes on an exchange server named MyMailServer we can easily come up with:
SELECT AverageDeliveryTime
FROM Win32_PerfFormattedData_MSExchangeIS_MSExchangeISMailbox
WHERE Name='First Storage Group-Mailbox Store (MyMailServer)'
Some Counters do not have an instance. This shows up as <<Instance_00>> in WMI Explorer. In these cases you can drop the WHERE clause. For example, to get Active User Count:
SELECT ActiveUserCount
FROM Win32_PerfFormattedData_MSExchangeMTA_MSExchangeMTA
The only thing left to do is save your query with the WQL extension and save it in the \Custom Sensors\WMI WQL scripts sub folder of your PRTG program directory.
Voila! Instant WMI Custom Sensor.

Add comment