How can I monitor running processes on my Linux machine?
29 Replies
This article applies to PRTG Network Monitor 9 or later
Monitoring Running Processes in Linux
Prerequisites
- Installed and configured NET-SNMP
In some cases it might be useful to monitor if (and how often) a process on a Linux system is running at the moment. This can be done via SNMP, but therefore you need to apply some modification to your system's SNMP configuration.
SNMP Configuration (on device)
- Open your "snmpd.conf" file in a text editor and navigate to the end of the file.
- Add the following:
proc <process name>
- Replace <process name> with the name of the desired process
- IMPORTANT: It has to be exact the same name as in your process list. It might be necessary to use the process name as given in the sbin or bin directory.
- Run the command /bin/ps -e to get the process name to use.
- Restart your SNMP service to make the changes take effect.
Automatic Sensor creation with Device Template
This device template will poll the following:
- Process
- Status (prErrorFlag)
- Count
It will use the status for alerting by default. You can however define additional limits for the "Process Count" channel. The usage of the device templates makes the deployment of sensors easier, especially if there are several devices or processes that you would like to monitor.
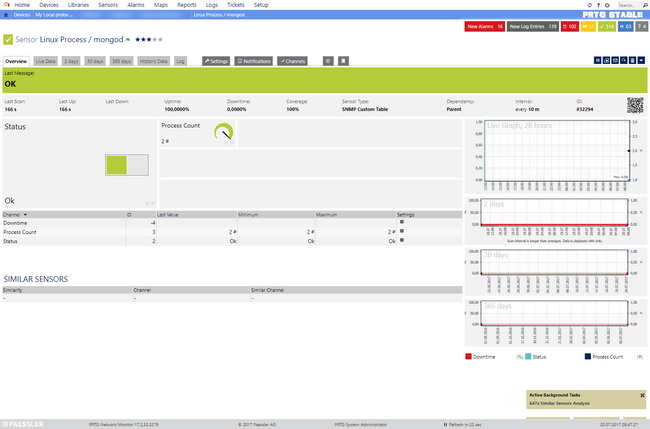
Device template deployment and Usage
- Download the required zip archive here.
- Extract the archive to your PRTG program directory. By default, this is %Program Files (x86)%\PRTG Network Monitor\.
- In PRTG, restart the core server: open Setup | System Administration | Administrative Tools | Restart Core Server and click Go!. This ensures that the MIB and lookups are loaded before you run the auto-discovery.
- Create a new device in PRTG with the address (IP or FQDN) of the device that you want to monitor and configure the SNMP credentials accordingly.
- Right-click your new device, select Run Auto Discovery with Template, and select the Custom UCD-SNMP Linux Process v0.x from the list.
Note: Using the auto-discovery with a dedicated device template is convenient here because it automates the creation of the custom sensors in an organized fashion. - The sensors are deployed after a couple of seconds.
- You can adjust the channel limits or lookups to your needs later.
Template Version History
0.1 | Initial Release |
0.2 | Fixed the snmp_prTable check |
Manual Sensor creation
You can also deploy the sensor's manually if you don't want to use the auto-discovery. Please proceed as follows:
- Open the PRTG web interface
- Add the device you want to monitor
- Add a new SNMP Library sensor, then choose Basic Linux Library
- The process, from the step above, will be shown somehow like this:
MIB Module | Category | Name | |
---|---|---|---|
Basic Linux Library (UCD-SNMP-MIB) | Processes: 1 | Processes Index | |
Basic Linux Library (UCD-SNMP-MIB) | Processes: 1 | Processes Count | |
Basic Linux Library (UCD-SNMP-MIB) | Processes: 1 | Processes Error Flag |
Select the value you want to monitor (Example: "Processes Count" shows how often the process is running) and click on Continue
- Go to sensor's Settings tab and rename the sensor to match your process
If you want to add another process just follow the steps above, the new process will be in category "Processes: 2", and so on.
Basically this is how to monitor your processes on a Linux machine.
This has been tested on Ubuntu, but should also work for every other distribution using NET-SNMP.
Note: This is also possible using our Custom Table Sensor, and it will allow for better naming of sensors and improved Auto-Discovery support. Tip: The Table's OID is 1.3.6.1.4.1.2021.2.
See Also
Created on Dec 13, 2011 1:55:24 PM by
Konstantin Wolff [Paessler Support]
Last change on Nov 2, 2022 2:48:58 PM by
Timo Dambach [Paessler Support]
Hey guys,
I am going monitoring Linux process by snmpd.conf above the article. But, i have a doubt. i added a sensor, in my case 'process:1' process count -> 'actually its httpd'
- In this moment its stopped, so my sensor mak 0 in process count, ok. But its green. How to configure for when count ==0 sensor stay red?
tks a lot!
Hi,
in the overview of the affected sensor, please switch to the "Channels" tab. There please choose the correct channel and enable the limits for this channel. There you may set your lower error limits.
Best regards
this is not what was asked:
how can i monitor running processes on linux? the number of running processes, i.e. MIB 1.3.6.1.2.1.25.1.6.0
this is working on one host and not on another. both running same OS both using exactly the same snmpd.conf
@amirtal: May you please elaborate on the precise issue? What exactly is not working? Do you get any error messages?
When creating a sensor to monitor a Linux Process I select SNMP Library. I then select the Basic Linux Library (ucd-snmp-mib).oidlib library file. After selecting Basic Linux Library (ucd-snmp-mib).oidlib I do not get Category "Processes: 1" nor do I get anything with "Process Count" in the name list.
The only Categories that are available to select from are Memory, System Stats, and CPU Load.
I can monitor the system with other Linux SNMP Sensors.
I have modified snmpd.conf file with proc sshd as the last line in a very basic conf file.
snmpd.conf file
#ASM SNMPD Config rocommunity public syslocation "Alpharetta, GA" proc sshd
What might I be missing when attempting to create a sensor to monitor a Linux Process? Are the Process Categories still available to chose from? Is the right Linux MIB File installed on the PRTG Server?
Created on Dec 9, 2015 3:30:18 PM by
jessev
(0)
Last change on Dec 9, 2015 3:48:56 PM by
Torsten Lindner [Paessler Support]
@jessev: Could you please run
ps -e |grep sshd
What results do you get? EDIT: Are you able to add other SNMP Sensors (e.g. Uptime)?
Created on Dec 9, 2015 8:20:36 PM by
Konstantin Wolff [Paessler Support]
Last change on Dec 9, 2015 8:21:20 PM by
Konstantin Wolff [Paessler Support]
Hi I have the same problem! when monitor a process and it not running the sensor stay Green and not send notification !
please update us
@chikosan: The sensor above by default reads a value. It does not 'know' if this value is good or bad. So, to get a notification, please set a lower warning limit for the channel value in the Sensor Channel Settings of the Processes Count. The sensor should then go to an error state when the number drops to 0.
After following this article I had the same issue. I went to the sensor channel and in the lower error limit I entered 0 but the sensor will still show OK and stay green although the service on the box was stopped. What I did for it to work is instead of entering 0 in the lower error limit I entered .1 that seemed to fix the issue. PRTG is now showing error when the service is stopped and Green when it is started. Hopes this helps.
very useful article. thanks
It´s possible to monitor more then twelve processes? In the SNMP Lib there are only twelve process sensor, but I´ve thriteen processes on my linux system.
@Marc Boettcher: This seems to be a limitation of NET-SNMP itself. So monitoring 13 processes is not possible then. Sorry.
will this handle processes with spaces in them? like "bash /bin/something"?
If so, does it require quotes around it?
@chlsmith thank you for your inquiry. I'm unable to confirm that, the net-snmp documentation page does not mention/specify that:
I encourage you to give it a try.
Best Regards,
Luciano Lingnau [Paessler Support]
Created on Oct 11, 2017 9:01:57 AM by
Luciano Lingnau [Paessler]
Last change on Oct 11, 2017 9:02:04 AM by
Luciano Lingnau [Paessler]
Это мониторинг процессов, а необходимо именно именно служб. Как это сделать в версии 17.3?
This is the monitoring of processes, and it is the services that are needed. How to do this in version 17.3?
Hi there,
The above guide still applies to the most recent version and your version as well.
Best regards.
Process and service are different things.
Example: ps -e | grep postfix
Returns nothing
Example: service postfix status
Returns
- postfix is running
Hi there,
Is it possible that the postfix has a different process name? Could you try the following command instead?
ps | grep [p]ostfix
Best regards.
# ps | grep p 58568 pts/3 00:00:00 sudo 58641 pts/3 00:00:00 su 58642 pts/3 00:00:00 bash 58755 pts/3 00:00:00 ps 58756 pts/3 00:00:00 grep
Nothing like this
Created on Feb 6, 2019 9:22:47 AM by
K0NCTANT1N
(70)
●1
Last change on Feb 6, 2019 11:45:18 AM by
Dariusz Gorka [Paessler Testautomation]
Hi there,
As what user are you logged in? Is it possible that the postfix service runs a different user and you are not able to get the "ps"-output of other user accounts?
Best regards.
Full root rights
Hi there,
Might be worth to check what process listens on port 25:
# sudo lsof -i :25 COMMAND PID USER FD TYPE DEVICE SIZE NODE NAME master 5664 root 12u IPv4 13732 TCP *:smtp (LISTEN)
Afterwards check the returned PID like this:
# ps p 5664 PID TTY STAT TIME COMMAND 5664 ? Ss 0:12 /usr/lib/postfix/master
Best regards.
Example, I need to monitor exactly whether the services are running: amavis, clamav, mysql, postfix
Hi there,
This is clear. But the above procedure only applies to processes. So a process can have an entirely different name from the actual service.
Best regards.
Please specify the link where the service monitoring method is specified.
Hi there,
There is no guide or documented way to do this. The only way is documented above, by monitoring the process behind the service.
Best regards.
Hi,
Sure, using a custom sensor via SSH is an option - but this is not an already in PRTG implemented option. If the script above helps you, great! :)
Best regards.
Add comment