Can probes be distributed to monitor branch offices (or similar)? Or is it possible to use multiple probes for load-balancing? If so, how to do it?
Is it possible to work with more than one probe from one PRTG server? How to use multiple probes?
Votes:
0
1 Reply
Votes:
0
This article applies to PRTG Network Monitor 12 or later, as well as to previous (deprecated) versions
Working with Multiple Probes and Remote Probes in PRTG
PRTG has two modules that perform the monitoring: The core server, which handles data storage, web server and a lot more, as well as one or more "probes" which perform the actual monitoring.
Situations That Require Monitoring Using Remote Probes
Upon installation, PRTG creates the first probe automatically called the "local probe". The local probe runs on the same machine as the core server and monitors all sensors from this system. Working with only one local probe should suffice for LAN monitoring and if you have just one location that you need monitoring for.
However, there are several situations that might make it necessary to work with multiple probes or remote probes:
- If you have more than one location and you need to make sure that services are available from all locations.
- If your network is separated in several LANs by firewalls and the local probe can not monitor specific services across the firewalls.
- If you need to monitor systems in VPNs across public or in-secure data lines.
- If you want to sniff packets on another computer.
- If you want to monitor NetFlow data on another computer.
- If you experience performance issues with CPU intensive sensors like packet sniffing or NetFlow sensors and need to distribute the load onto more than one PC.
- If you want to monitor Quality of Service (QoS) to test network connection quality between two probes.
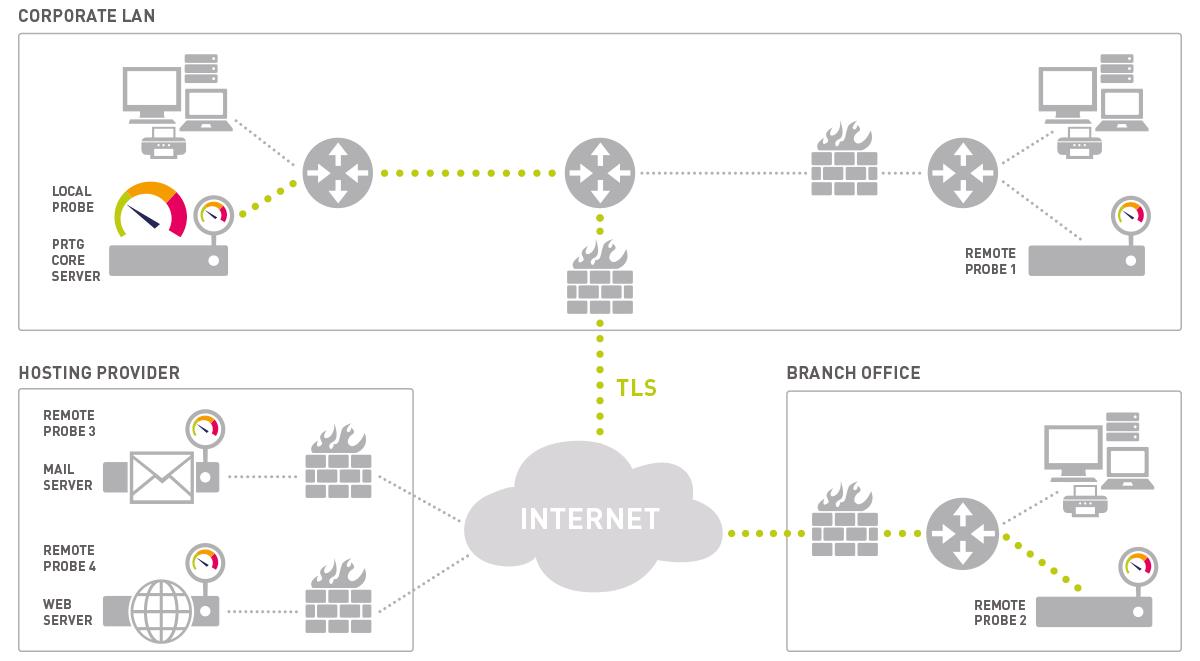
The following chart shows an example: The PRTG Core Server inside the "Corporate LAN" (bottom right) is able to monitor
- services inside the "Corporate LAN" using the "Local Probe"
- services behind a firewall in the "Corporate LAN" using "Remote Probe 1"
- secured services inside the "Branch Office" (top left) using a "Remote Probe 2" installed on a dedicated probe server
- secured services on "Mail Server" and "Web Server" using "Remote Probe 3 and 4" installed directly on these servers
- public services on the Internet using any of the probes.

How Probes Work
As soon as a Probe starts to work, it automatically connects to its Core Server, downloads the sensor configuration and begins its monitoring tasks. The core server sends new configuration data to a probe as soon as the monitoring configuration is changed by the user (for example a new sensor is added). Probes monitor autonomously and send the monitoring results back to the core server for each check they have performed. If the connections between core and probe fails for any reason (e.g. a reboot of the core) the probe continues its monitoring and stores the results.
The connection between probe and core is initiated by the probe, secured using SSL (Secure Sockets Layer). This means that the data sent back and forth between core and probe is not visible to someone capturing data packets. The core server provides an open TCP/IP port and waits for connection attempts from probes. If a new probe connects for the first time the administrator will receive a ToDo ticket and will then see the new probe in the device tree. As a security precaution, the probe must be manually approved by the administrator (Click on "accept") before any sensors can be created and monitored. The admin can also deny a probe which will then be disconnected. No further connection attempts will be accepted (the probe IP is added to the "Deny IPs" list in the probe system settings). This ensures that unauthorized probes can not connect to a core server.
Since the probe initiates the connection, you must ensure that it can be created from the outside world onto your core server, e.g. you may need to open any necessary ports in your firewall and you may need to specify a NAT rule for your network. The process is the same when you want to allow access to the web server of the core server via port 80.
Note: The local probe is automatically configured and approved and connects to the core via localhost (127.0.0.1) and SSL.
More
- Is there a client to monitor machines while they are off the network?
- For any further instructions and information, please visit the according part of the PRTG manual: Remote Probes and Multiple Probes
- See also animated video "Core Server and Remote Probes" on our Video Tutorials page.
Created on Feb 2, 2010 4:06:50 PM by
Torsten Lindner [Paessler Support]
Last change on Aug 14, 2018 11:51:51 AM by
Luciano Lingnau [Paessler]
Add comment