This article applies as of PRTG 22
Overflow Values in SNMP Compatibility Options
Note: After an update to any version as of PRTG 12.3.x, you might encounter graphs of your SNMP Traffic sensors that look scrambled. To see what the issue is here, see the note about a bugfix at the end of this article.
PRTG provides the option to define the handling of overflow values in the SNMP Compatibility Options on device and group level. This setting is useful if you monitor a device with incorrect overflows and experience issues with monitoring data because of this.

Click to enlarge.
PRTG automatically detects counter overflows
Counter overflows are normal when monitoring 32-bit SNMP counters. Usually, PRTG correctly detects overflows and shows valid data from your devices. Therefore, we recommend that you use the Handle overflow values as valid results option.
Try the compatibility option Ignore (default) only if you experience problems with wrong data sets. This is most likely due to switches and routers that do not follow the SNMP specification. If PRTG detects a counter overflow, it ignores the data returned by your device and writes a 0 (zero) value to the database instead.
Note: This correctly shows the data of other channels but leads to drops in the graph (see below).
Use SNMP v2c if possible
We recommend that you use SNMP v2c if supported by your devices. This version can use 64-bit counters to generally avoid counter overflows altogether:
- In the Credentials for SNMP Devices section of the device that represents your switch or router, set the SNMP Version to SNMP v2c.
- Then add your SNMP sensors anew. Existing sensors continue to use the former SNMP version setting and to show the drops.
- Note: Historic data cannot be transferred to the new sensors, but you can pause the old sensors to keep their data.
If your graphs show drops

Click to enlarge.
If your graphs show regular drops as shown in the screenshot above, there may be different reasons for this.
- The scanning interval of the sensor may be too short. For example, if your device only provides new counter data every minute, and you have set your sensor to scan the device every 30 seconds, this will lead to a 0 (zero) value for every other sensor scan.
Try to increase your SNMP sensors' scanning interval.
- The device might correctly report data, but PRTG may be set to ignore overflow values. In this case, try the following:
- Edit the settings of the device in PRTG that represents your switch or router.
- In the SNMP Compatibility Options, set the Overflow Values option to Handle overflow values as valid results.
Note: Changes to this setting immediately take effect for all newly collected data (this data is used, for example, for report generation). However, you will need to recalculate cached graph data to see the change in the graphs of your historic data tabs (by default, these are the 2 days, 30 days, and 365 days tabs).
You can Recalculate the PRTG Graph Data Cache under Setup | System Administration | Administrative Tools in the PRTG web interface.
If your graphs show peaks
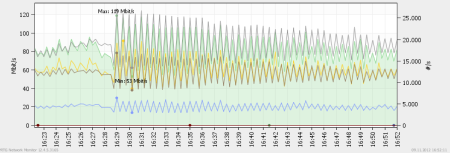
If your graphs show strange peaks as shown in the picture above, this may indicate that your device resets counters without an overflow. PRTG interprets such a behavior as an overflow, which leads to peaks in data. Try the following:
- Edit the settings of the device that represents your switch or router.
- In the SNMP Compatibility Options, set the Overflow Values option to Ignore (default).
Note: Changes to this setting immediately take effect for all newly collected data (this data is used, for example, for report generation). However, you will need to recalculate cached graph data to see the change in the graphs of your historic data tabs (by default, these are the 2 days, 30 days, and 365 days tabs).
You can Recalculate the PRTG Graph Data Cache under Setup | System Administration | Administrative Tools in your PRTG web interface.
This information applies as of PRTG 12.3.1.2365
A bugfix in PRTG 12.3.1 changed the way PRTG handles SNMP Overflow Values
Until PRTG 12.2, a bug existed: The functionality of the Overflow Values setting in the SNMP Compatibility Options (this can be set, for example, on group level) functioned the wrong way around.
We corrected this error as of PRTG 12.3.1.2365/2366 (released July 19th 2012).
This means that if you set PRTG to Ignore overflow values, overflow values were actually handled as valid results in the buggy versions. They will be ignored after an update to PRTG 12.3 or later.


Add comment