This article applies as of PRTG 24
Set Limit Markers in Graphs
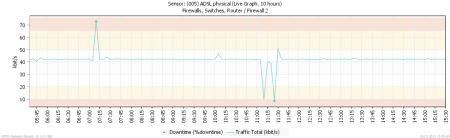
Graphs in PRTG will automatically display limits you set in the sensor channel settings. You can set upper/lower error and/or warning limits. Limits will automatically set a sensor into Warning and/or Down status. Each limit will automatically be shown as a yellow or red area in a sensor graph if you configure the graph to show one sensor channel only.
| Sensor Channel Limit | Color of Area in Graph |
|---|
| Upper Error Limit | red |
| Upper Warning Limit | yellow |
| Lower Warning Limit | yellow |
| Lower Error Limit | red |
For example, a traffic graph with limits can look like the following:
Click here to enlarge.
Configuration Step-by-Step
In order to create a graph display like this, please ensure the following:
- In the sensor channel settings, in the Display section, set the option Hide from graphs for all sensor channels except for one—the one you want to have a graph with limits for.
- For the remaining sensor channel, in the Limits section, Enable Limits and set error and/or warning limits. Save your settings.
- Return to the sensor’s Overview tab to check the graph display. In order to get a filled graph, set the remaining sensor channel as Primary channel for this sensor. All other sensor channels will be displayed as a line only.
Note: To see the error and/or warning limits on the vertical axis of the graph for a sensor that has only one channel, assign a value that is at least equal to or higher than the maximum error and/or warning limit, to the vertical axis in the Edit Channel window of the sensor.
 Click to enlarge.
Other alternative(s):
For "visual markers" only (a limit which doesn't affect the sensor's status) you can use a Sensor Factory Sensor.


Add comment