I want to add a PerfCounter Custom sensor to my PRTG installation. Unfortunately, I do not know exactly which performance counters I can monitor and what their names are. Where can I find a list of available performance counters and how can I add them to the sensor for monitoring?
6 Replies
Votes:
0
This article applies as of PRTG 22
Obtaining performance counters
Depending on the target system, the list of available performance counters can vary. It can also be extensive, since there are usually hundreds of counters. It is therefore not possible to have a whole list of counters available in PRTG.
To find out which performance counters are available on your system and how to add them to PRTG, follow the steps below.
Steps to take
- Start perfmon.exe on your target Windows system. Microsoft provides this tool on all Windows systems. You can search for all available performance counters there.

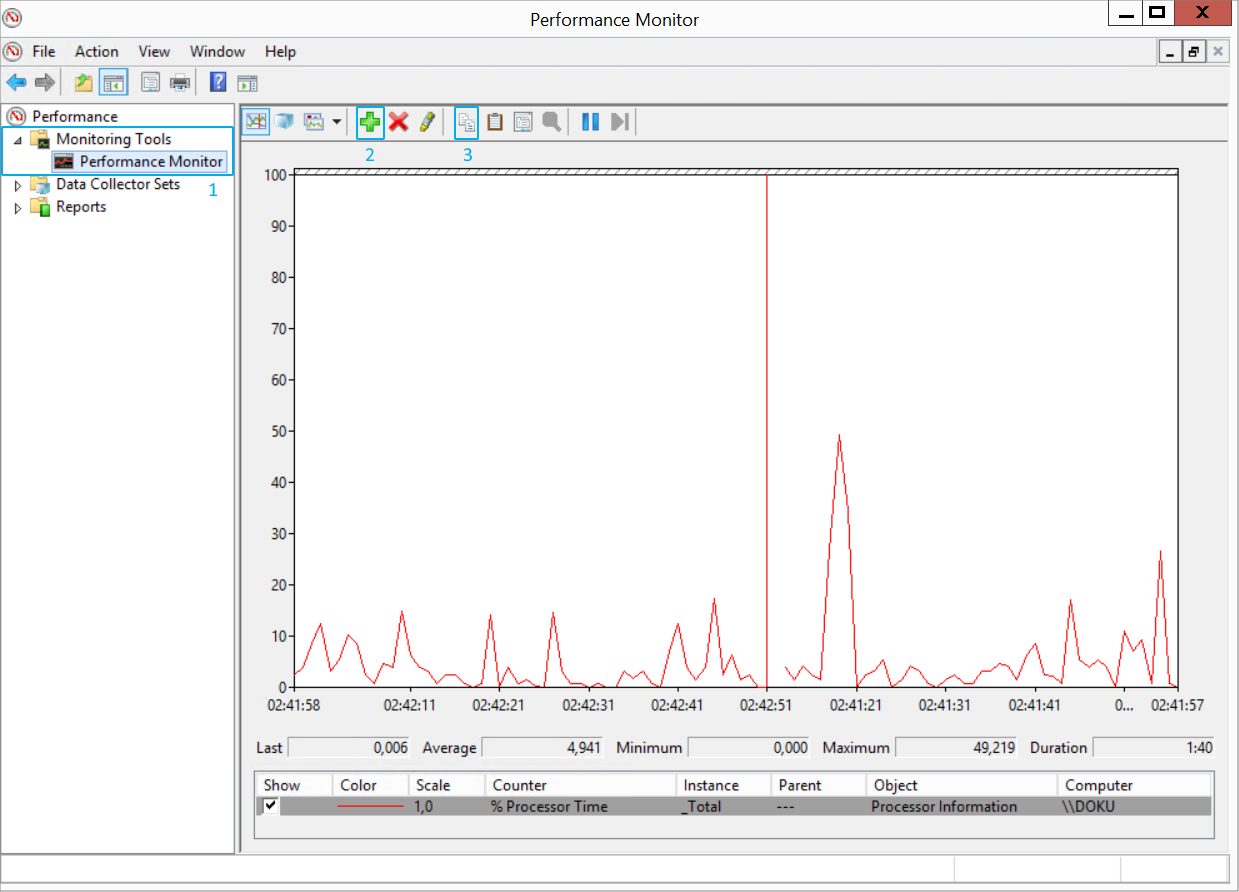
Click to enlarge. - In perfmon, select Monitoring Tools | Performance Monitor (1).
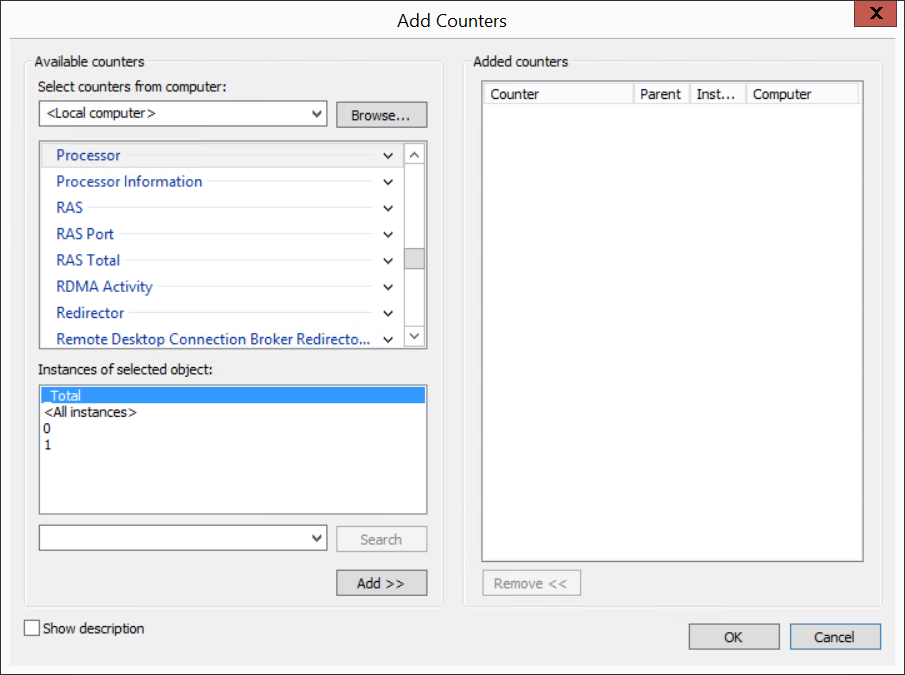
- Click the green plus symbol (2). This opens a window with available performance counters.

Click to enlarge. - Search for the counter of your interest, add it, and click OK. Best practice is to select only one counter.
- Click the copy symbol (3) to copy properties.
- Paste the properties into a text editor.
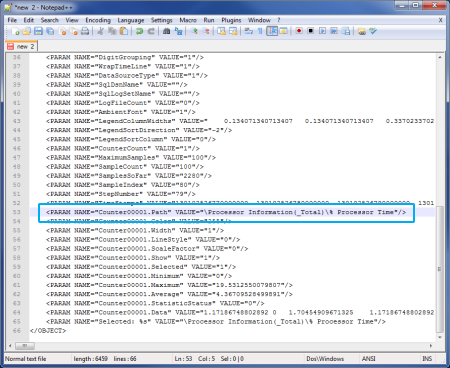
- In the copied code, search for the name of the desired counter. A counter name is indicated by Counter[…].Path. The corresponding line for our example looks like this:
<PARAM NAME="Counter00001.Path" VALUE="\Processor Information(_Total)\% Processor Time"/>
Click to enlarge.
- Copy the text within the quotes after the keyword VALUE=. Here, it is \Processor Information(_Total)\% Processor Time.
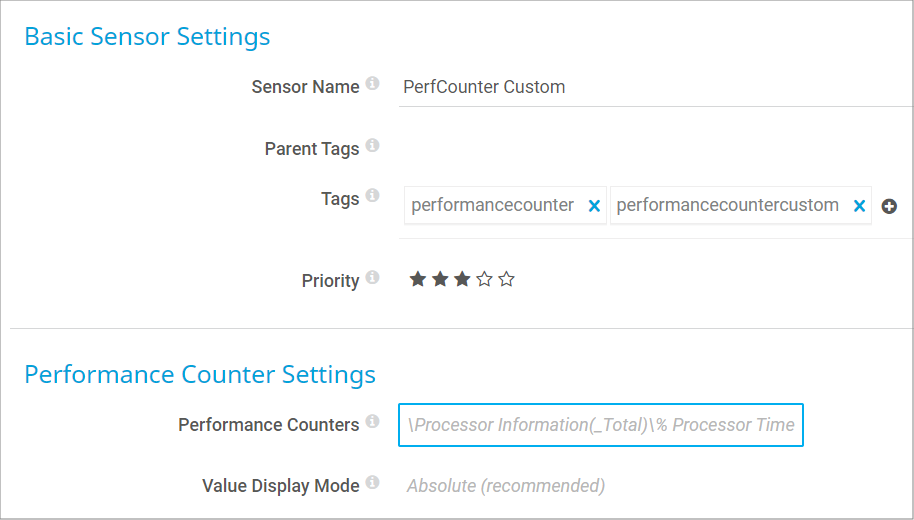
- This is what you have to provide in the settings of the PerfCounter Custom sensor in the Performance Counters field. The counter name must be followed by two colons (::) and a specific unit (here, percentage %).

Click to enlarge.
After you click Create in the add sensor dialog, PRTG immediately starts to monitor the corresponding performance counter.
Troubleshooting
See My performance counter sensor does not work. What can I do? if PRTG cannot remotely access specific available performance counters and shows the error message The specified object is not found on the system.
Created on Apr 19, 2013 11:44:35 AM by
Gerald Schoch [Paessler Support]
Last change on Jan 4, 2023 10:07:19 AM by
Brandy Greger [Paessler Support]
Votes:
0
Tip: If the counter contains one of the following characters: " < > & this character will be replace, because they are not allowed in xml. you can see a list of the replacements here:
| character | replacement |
|---|---|
| " | " |
| < | < |
| > | > |
| & | & |
if you counter contains one of these replacement strings, you will need to undo the replacement, before you can use the performance counter with the sensor.
If the counter in xml is for example "\Memory\Free & amp; Zero Page List Bytes", you need to use "\Memory\Free & Zero Page List Bytes" instead.
Votes:
0
I can't see any reference to perfmon counter unit values, here or in the online help entry for this sensor, /help/perfcounter_custom_sensor.htm. Only the unit "%" is referenced. What are the valid unit types, besides "%"?
Votes:
0
The actual unit can be anything you like - even ::SuperUnit :)
Votes:
0
Can u please share an example, i am trying to add following counter but get an error
\TCPv4\Segments Retransmitted/sec::
\TCPv4\Connections Reset::
\TCPv4\Connection Failures::
What unit should i use to add these counters
Created on Oct 15, 2018 4:23:35 PM
Last change on Oct 15, 2018 5:54:03 PM by
Stephan Linke [Paessler Support]
Votes:
0
# should do the trick - or Segments, Resets, Failures (for the corresponding counters).
Add comment