What is this?

This knowledgebase contains questions and answers about PRTG Network Monitor and network monitoring in general.

Learn more

PRTG Network Monitor

Intuitive to Use. Easy to manage.
More than 500,000 users rely on Paessler PRTG every day. Find out how you can reduce cost, increase QoS and ease planning, as well.

Free Download

Top Tags


View all Tags

Report (graph) without historical data

Votes:

0

is it possible to remove the histrical data graph from a report? I only need the period graph but not a second one with historical data. Any try to edit the report .htm fails. What i have to do?

Screenshot : http://s14.directupload.net/file/d/3283/ehhvcdey_jpg.htm

custom graph reports

Created on Jun 11, 2013 9:19:06 AM


3 Replies

Votes:

0

If you want to remove this graph, you can edit the report sub-template that is in the details folder of the reports template. For example the sub report for the A30 report template is called "details\Graph plus 30day graph and Table.htm". In that file, you should find a line starting with <#report type="chart" graphid="<@subid>" repsensid="<@objectid>" avg="3600" if you remove that line you will get the result desired.

I would suggest creating this with a new template in case anything goes wrong and technically we do not support doing this so if something breaks horribly we may not be able to help. You may also want to take a look at this article on editing templates.

Created on Jun 11, 2013 11:56:17 AM by  Greg Campion [Paessler Support]

Last change on Jun 11, 2013 11:58:39 AM by  Greg Campion [Paessler Support]


Votes:

0

This i tried yesterday, but if I change anything in this template, I only get error messages.

Here you can see what happens if I change anything in this template:http://s1.directupload.net/file/d/3283/x27awuof_jpg.htm

I use the template "B11 Graph Only - 24.htm" which uses the sub-template "Graph plus 365day graph". In this file i removed the following line (with a html editor):

  1. report type="chart" graphid="&lt;@subid&gt;" repsensid="&lt;@objectid&gt;" avg="86400"

after that change I got the error you can see below in the screenshot.

(I also deletet more lines:

  1. report type="chart" graphid="&lt;@subid&gt;" repsensid="&lt;@objectid&gt;" avg="86400" sdate="&lt;@start&gt;" edate="&lt;@end&gt;" startoff="-365" endoff="0" width=850 height=220 graphstylefile="graphstyling.htm" animationandinteraction="1" datastylefile="graphdatastyling.htm" animationstylefile="graphanimationstyling.htm" graphstyling="baseFontSize='9'%20showLegend='0'" tooltexts="1" datastyling="drawAnchors='1'%20anchorRadius='1'%20lineThickness='1'" refreshable="true"&gt;

same error)

What`s wrong?

Created on Jun 11, 2013 1:17:08 PM


Votes:

0

I named the file shown below "Graph plus 365day graph - Modified.htm" and then created a copy of the B11 graph and renamed that to "B12 Graph Only Mod - 24h.htm". In the new "B12 Graph Only Mod - 24h.htm" I referenced the new "Graph plus 365day graph", and it worked like you want it to work.

Below is the code for the two files.

Graph plus 365day graph - Modified.htm

<div class="onereport report<@counter>">
	<img src="/images/reportheader.png">

	<h1><#objectproperty name="name">: <b><#objectproperty id="<@objectid>" name="name"></b></h1>

	<table cellspacing=0 class="overview">
		<tr class=even>
			<td class=title><#lang key="html.reporttemplates.reporttimespan" default="Report Time Span">:</td>
			<td colspan=6><#report type="startdate"> - <#report type="enddate"></td>
		</tr>
		<tr class=odd>
			<td class=title><#lang key="html.reporttemplates.reporthours" default="Report Hours">:</td>
			<td colspan=6><#report type="reporthours"></td>
		</tr>
		<tr class=even>
			<td class=title><#lang key="html.reporttemplates.sensortype" default="Sensor Type">:</td>
			<td colspan=6><#objectstatus name="type" id="<@objectid>"> (<#objectstatus id="<@objectid>" name="interval"> <#lang key="html.reporttemplates.interval" default="Interval">)</td>
		</tr>
		<tr class=odd>
			<td class=title><#lang key="html.reporttemplates.probegroupdevice" default="Probe, Group, Device">:</td>
			<td colspan=6><#objectstatus id="<@objectid>" name="probe" show="textshort"> &gt; <#objectproperty id="<@objectid>" name="ParentGroup" show="text"> &gt; <#objectproperty  id="<@objectid>" name="ParentDevice" show="text"></td>
		</tr>
		<@loop>
	</table>

	<div class="reportgraph">
	<#report type="chart" graphid="<@subid>" repsensid="<@objectid>" avg="<@graphaverage>" sdate="<@start>" edate="<@end>" width=850 height=530 graphstylefile="graphstyling.htm" animationandinteraction="1" datastylefile="graphdatastyling.htm"  animationstylefile="graphanimationstyling.htm" graphstyling="baseFontSize='12'%20showLegend='0'" tooltexts="1" datastyling="drawAnchors='1'%20anchorRadius='1'%20lineThickness='2'" refreshable="true">
    <div style="width:850px"><#report type="legend" repnodeid="<@subid>" repsensid="<@objectid>" width="850"></div>
	</div>

	<br>

	<#report type="averagetable" repnodeid="<@subid>" repsensid="<@objectid>" avg="<@tableaverage>" sdate="<@start>" edate="<@end>">

</div>

B12 Graph Only Mod - 24h.htm

<!--Graph only: Graph only (24h interval)-->
<!--10-->
<#lang key="html.reporttemplates.title" default="Report" var="title">
<#include file="includes\reportheader.htm" varexpand="title" title=" | @title">

<#objectproperty name="reportheader">

<#report type="list" name="details\Graph plus 365day graph - Modified.htm" subname="details\Detail Loop.htm" graphaverage="86400">

<#cropmsg>

<#objectproperty name="reportfooter">

<#include file="includes\reportfooter.htm">

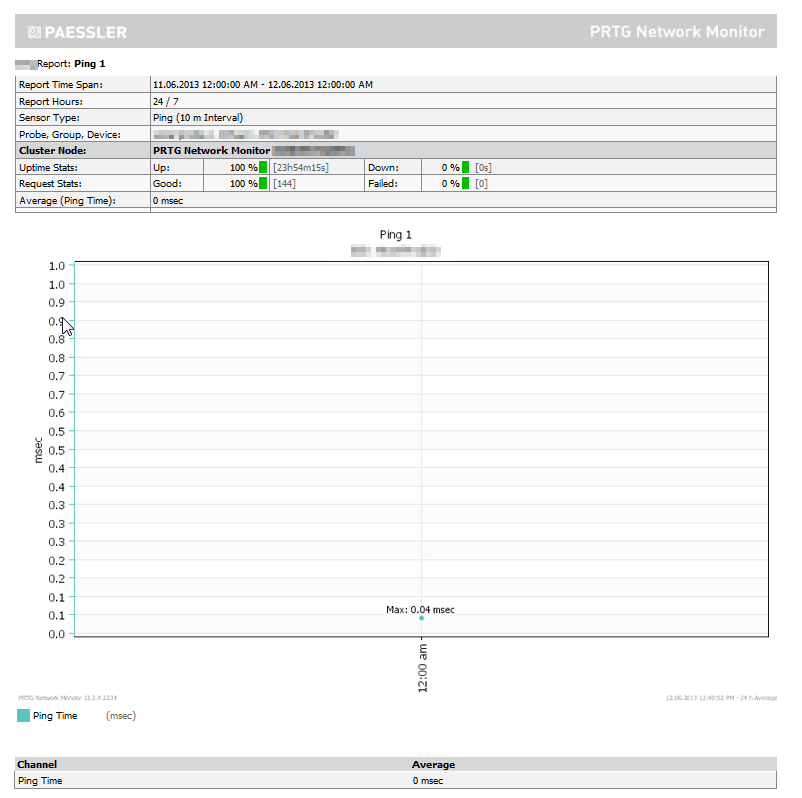
Make sure that both of these files are in the correct place. Once you have done this, the report should look like this:

History Tab

Full Size

Created on Jun 12, 2013 10:50:38 AM by  Greg Campion [Paessler Support]

Last change on Jun 12, 2013 11:04:34 AM by  Greg Campion [Paessler Support]


Disclaimer: The information in the Paessler Knowledge Base comes without warranty of any kind. Use at your own risk. Before applying any instructions please exercise proper system administrator housekeeping. You must make sure that a proper backup of all your data is available.