This article applies to PRTG Network Monitor 13.2.3 through 17.3.33
Customizing Reports: Showing Full Channel Names for Graphs
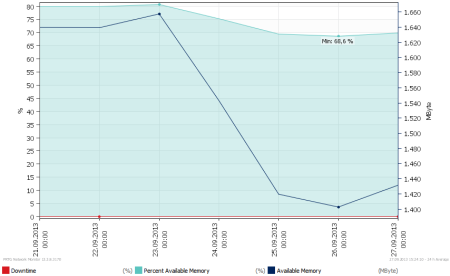
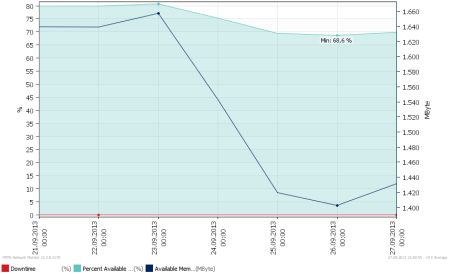
If you have channel names that are abbreviated with points in report graphs and you would like to see the whole names there, you can customize report templates to avoid name shortening. Enlarge the space for the graph legends to a suitable size and PRTG will show the original, long channel names in graphs.
Displaying Full Channel Names in Report Graphs
You have to edit three files in order to customize report templates in a way that there will be enough space for whole channel names in graph legends of reports:
- reportheader.htm in the \webroot\includes subfolder of your PRTG installation
- A report template in the \webroot\reporttemplates subfolder of your PRTG installation. Choose the template file for the report in which you would like to enlarge the space for graph legends.
- styles_custom.css in the \webroot\css subfolder of your PRTG installation
For details, please follow the steps below.
Step 1: Preparing Report Header
- Make a copy of reportheader.htm within the \webroot\includes folder.
- Rename the copied report header file, for example: reportheader_custom.htm
- Open reportheader_custom.htm with a text editor.
- Change the last line (default) in this file from
<body id=“reportbody“> to <body id="reportbody" class="widelabel">
- Save the file.
Step 2: Preparing Report Template
- Make a copy of the report template you want to adjust within the \webroot\reporttemplates folder. Choose, for example: B11 Graph Only – 24h.htm
- Rename the copy, for example: B12 Graph Only Widelabel – 24h.htm
- Open the copy (“B12 Graph Only Widelabel – 24h.htm”) with a text editor.
- Include the customized report header file: Edit the line defining the include file and provide the name of the customized report header, for example:
<#include file="includes\reportheader_custom.htm" varexpand="title" title=" | @title">
- Change the name of the template after the colon (as it is listed in PRTG) in the first line of the file, for example:
<!--Graph only: Graph only widelabel (24h interval)-->
- Optionally, define a new template “group” name in the first line before the colon. This will give the template an own caption in the template selection in PRTG’s web interface. For example, add “Custom”:
<!--Custom Graph only: Graph only widelabel (24h interval)-->
- Save the file.
Finally, the customized template file “B12 Graph Only Widelabel – 24h.htm” will look like this:
 <!--Custom Graph only: Graph only widelabel (24h interval)-->
<!--10-->
<#lang key="html.reporttemplates.title" default="Report" var="title">
<#include file="includes\reportheader_custom.htm" varexpand="title" title=" | @title">
<#objectproperty name="reportheader">
<#report type="list" name="details\Graph plus 365day graph.htm" subname="details\Detail Loop.htm" graphaverage="86400">
<#cropmsg>
<#objectproperty name="reportfooter">
<#include file="includes\reportfooter.htm">
Step 3: Preparing CSS File
- Open styles_custom.css in the \webroot\css folder with a text editor.
- Add the following line:
body.widelabel .oneitem{width: 250px;}
- Save the file.
Step 4: Check the Customization in PRTG
- Open PRTG’s web interface.
- Add a new report: Choose Reports| Add Report from the main menu bar.
- In section Template, choose the custom report template you created before from the drop down menu (“B12 Graph Only Widelabel – 24h.htm”). If you have defined a custom template group, you will find the template there, for example: Custom Graph Only
- Click on Continue and choose the sensors for this report.
- Open the tab Run Now and click the corresponding button to run the report.
Finally, these steps applied to report graph example from above, the channel names in the graph legend will look like this:

Note: Perhaps you have to reload the CSS to see the customization of the report. Press Ctrl+F5 in the report window.
 Abbreviated Channel Names
Add comment