This article applies as of PRTG 22
Event log sensors: Setting correct status and source filter
PRTG comes with two types of sensors for Windows event log monitoring:
- The WMI Event Log sensor monitors a specific Windows log file via Windows Management Instrumentation (WMI).
- The Event Log (Windows API) sensor uses the Windows Application Interface (Windows API) to monitor event log entries.
To make these sensors show a desired status for certain event log entries, you must define filters via channel settings.
How to define the Down status for specific events
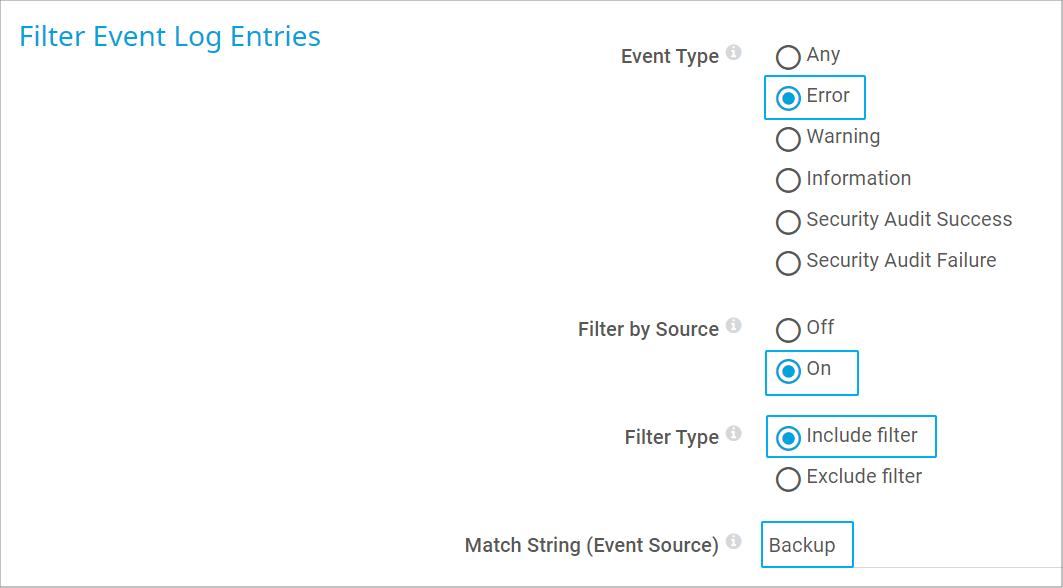
You can easily set up the sensor to change to a desired status when a specific event occurs. For example, if you filter for Error as Event Type, you might want the sensor to change to the Down status as soon as one log entry is of this type.
Click to enlarge.
After you created a corresponding filter in the sensor settings that only analyzes specific events, follow these steps:
- Open the settings of the sensor’s default primary channel New Records.
- In the Edit Channel dialog, click Enable alerting based on limits.
- Enter 0,0001 in the Upper Error Limit (#/s) field.

Click to enlarge.
If at least one log entry is of the type Error, the sensor changes to the Down status. You can use other and/or more filters and individually define sensor states that apply if one log entry matches this filter.
This status persists for one scanning interval. If the filter does not match in the following scanning interval, the sensor changes to the Up status again. Create a State Trigger on the Notifications tab of the sensor with a corresponding notification to make sure that you do not miss any uncommon event log entry.
How to filter for the correct source
When you filter for a specific source (for example, you use Backup in the Match String (Event Source) field of your sensor), the sensor sometimes does not react to an event from this source. In this case, the value in the event viewer probably does not correspond to the value that is really given in the event.
You can check this by storing the sensor results to disk and testing the executed WMI query with WMI Tester. Follow the steps below:
- In the settings of the WMI Event Log sensor, select the option Store result. (This setting is currently not available for the Event Log (Windows API) sensor.)
- Perform an immediate sensor scan: click Scan Now in the sensor’s context menu.
- Open the file Result of Sensor [ID].txt in the \Logs\sensors subfolder of the PRTG program directory on the probe system. You then see the WMI queries as generated by this sensor.
- Test the latest query with WMI Tester. If you do not get any results on your system, the queried source value might be different from the value in the event itself.
Use WMI Tester to find out which value is really deposited at the time stamp that you see in the sensor result file:
- In the executed query in the sensor result, look for the parameter TimeGenerated and copy its value.
- Execute the following command with WMI Tester and paste the copied time stamp:
SELECT * FROM Win32_NTLogEvent WHERE Logfile ='Application' AND TimeGenerated > ‘copied_timestamp’ Note: Adjust the value for the Logfile parameter to the one that you have set in the sensor settings.
- Analyze what source value is really deposited in the events and can be used for your purposes. For example, the source Backup, as it is called in the event viewer, could be MS-Windows-Backup instead.
- Alternative: On the Details tab of an event log entry in the event viewer, select the XML view and use the value from the <Provider Name> tag.
- Check if the value of the source that you have found out works with WMI Tester. If yes, provide this value in the (Match String) Event Source field in the sensor settings.
Your Event Log sensor, no matter if you use WMI or the Windows API, now reads the correct event sources and changes to the correct status.
More


Add comment