This article applies to PRTG Network Monitor 14 or later
Displaying Uptime, Downtime, and Coverage Statistics in Maps
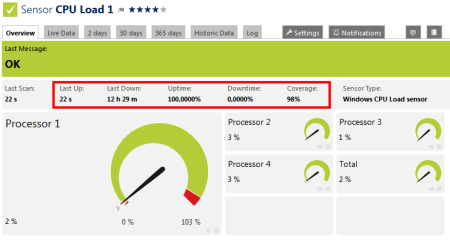
The values you can see for downtime %, uptime %, coverage %, and the elapsed time since the last down/up scans are not part of default map objects. Because of, you have to create a custom map object if you want to have this information on your dashboards.
The HTML code below will provide you such an object:
- Copy the code and paste it into an editor.
- Name the file, for example, updowntime.htm
- Save the file into the \webroot\mapobjects subfolder of your PRTG installation.
- Create a new map or open an existing one where you want to add this object to.
- Select the Map Designer tab.
- Select the desired sensor on the left.
- Open the group Custom Map Objects on the right.
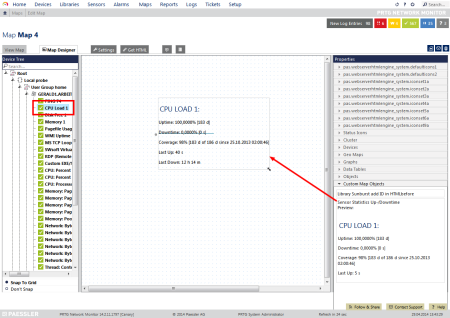
- Drag & drop the created object Sensor Statistics Up-/Downtime into the main window.
 Adding the Custom Map Object to a Map
HTML Code for Map Object “Sensor Statistics Up-/Downtime”
<!--Custom Map Objects: Sensor Statistics Up-/Downtime-->

<div class="map_object" id="<@itemid>" objectid="<@objectid>" subid="<@subid>" style="<#mapobject type="topleftcoordinates" subid="<@subid>" mode="<@editmode>">">
<#checkobjecttype objecttype="sensor" nicemessage="true" id="<@objectid>">
<#mapobject type="objectgrip" mode="<@editmode>">
<#mapobject type="htmlbefore" subid="<@subid>">
  <h2><#objectproperty name="Name" id="<@objectid>">:</h2>
  <#objectstatus name="downsens" id="<@objectid>">
  <p>
    Uptime: <#objectstatus name="uptime" id="<@objectid>"> [<#objectstatus name="uptimetime" id="<@objectid>">]
  </p>
  <p>
    Downtime: <#objectstatus name="downtime" id="<@objectid>"> [<#objectstatus name="downtimetime" id="<@objectid>">]
  </p>
  <p>
    Coverage: <#objectstatus name="knowntime" show="textshort" id="<@objectid>"> [<#objectstatus name="knowntime" show="htmllong" id="<@objectid>"> of <#objectstatus name="cumsince" show="textshort" id="<@objectid>"> since <#objectstatus name="cumsince" show="htmllong" id="<@objectid>">]
  </p>
  <p>
    Last Up: <#objectstatus name="lastup" show="htmllong" id="<@objectid>">
  </p>
  <p>
    Last Down: <#objectstatus name="lastdown" show="htmllong" id="<@objectid>">
  </p>
  <#mapobject type="htmlafter" subid="<@subid>">
</div>
Of course, you can adjust this map objects as you like. See the article How can I add or edit map objects used for PRTG's maps?
Note: You can find other possible values which you can add to this map object in the PRTG API documentation, tab Live Data, section Supported Output Columns: http://<your PRTG installation>/api.htm?tabid=3

 Adding the Custom Map Object to a Map
Add comment