I would like to monitor the quality of a network connection with the QoS Round Trip sensor. Is it necessary to install a remote probe on the target, that is, at the “end” of the connection, or is there a different option regarding where to send the UDP packets for quality of service measurements?
10 Replies
Votes:
0
This article applies as of PRTG 22
QoS round trip monitoring without remote probes
In general, PRTG measures the Quality of Service (QoS) of a connection by sending UDP packets from one end of the connection to the other end of the connection. Regarding the QoS (Quality of Service) Round Trip sensor, the traffic packets are sent back from the end of the line to the source and the sensor measures various QoS parameters of this packet round trip.
Because it is mandatory to have two endpoints for QoS measurements, you need a reflector for the UDP packets at the target. You can use a remote probe at the connection end for this purpose, or you can use the QoS Reflector. The source of the packets is a device that you added to PRTG.
QoS Reflector for the QoS Round Trip sensor (open source)
The QoS Reflector is a Python script that bounces all incoming UDP packets. Because of this, you can use it as a QoS endpoint on a device that you plug in at the end of the connection you want to measure, for example, on a small Raspberry Pi.
The main advantages of the QoS Reflector in comparison to a remote probe for QoS monitoring are the quick setup and that it is compatible with any platform that runs a Linux-based operating system, so you do not need a Windows device at the connection end. We provide the QoS Reflector as an open source project on GitHub. Follow the steps below to set up the reflector for a QoS (Quality of Service) Round Trip sensor.
Notes
- The PRTG QoS Reflector currently does not support the QoS (Quality of Service) One Way sensor.
- This is an experimental feature. Currently, it is in beta status. The methods of operating can change at any time, as well as the available settings. Do not expect that all functions will work properly, or that this feature works as expected at all. Be aware that this feature can be removed again from PRTG at any time.
- This article is provided for your information only. The steps described here have been tested carefully. However, we can neither offer deep technical support for customizing this script nor for writing your own scripts.
Requirements
You need to fulfill the following requirements on the device on which you want to use the QoS Reflector as the connection endpoint:
- Any Linux-based operating system
Note: Although originally written for Linux systems, you can use the QoS Reflector on Windows systems as well with minor changes to the script. - Python 2.7 or later: see python.org Furthermore, you need a PRTG core server version 14.x.12 or later to use a QoS (Quality of Service) Round Trip sensor with the reflector.
Setup
Follow the steps below to measure the quality of service of a connection with the QoS Reflector.
Step 1: Prepare and call the script
Basically, you just have to copy the QoS Reflector script to a device at the connection target and execute it.
- Download the QoS Reflector package from GitHub and copy it to your Linux distribution.
Note: If you want to set up the QoS Reflector on a Raspberry Pi, give the Raspberry Pi a static IP address and put qosreflect.py on the root of the storage system. - Make the file qosreflect.py executable, for example, use the following command:
chmod 755 qosreflect.py - Optionally, create a configuration file qosreflect.conf with the following content:
host:All port:50000 replyip:None - Execute the script:
./qosreflect.py [-h] [-p PORT] [-c CONF] [-o HOST] [-r REPLYIP] [-d] - Note: On a Raspberry Pi, we recommend that you set the QoS Reflector script to boot at startup.
We recommend that you use parameters with the script call. This enables you to run several instances of the PRTG QoS Reflector. The following parameters are available:
| Parameter | Description |
|---|---|
| --port PORT | Provide the port number as defined for the respective QoS (Quality of Service) Round Trip sensor in PRTG. |
| --host HOST | Provide the IP address of the interface that you want the script to bind to. We recommend that you use All to bind all available interfaces. |
| --replyip REPLYIP | Optional: Provide the IP address of the probe that sends the UDP packets. The reflector will only reply to this IP address. |
| --conf CONF | Optional: Use this parameter only if you do not use the port and host parameters in the command. The script will then use parameters as defined in your configuration file. Provide the path to the configuration. If you do not provide this argument, the default configuration file qosreflect.conf will be used. |
| --debug | Optional: Set this argument to get detailed debug output. |
| --help | Use this argument to show all available parameters. |
Example: ./qosreflect.py --port 50000 --host All
Step 2: Add a QoS (Quality of Service) Round Trip sensor to PRTG
If you have not created a QoS (Quality of Service) Round Trip sensor yet, do so now.
- Add the QoS (Quality of Service) Round Trip sensor to a device on any probe, depending on which connection you want to monitor.
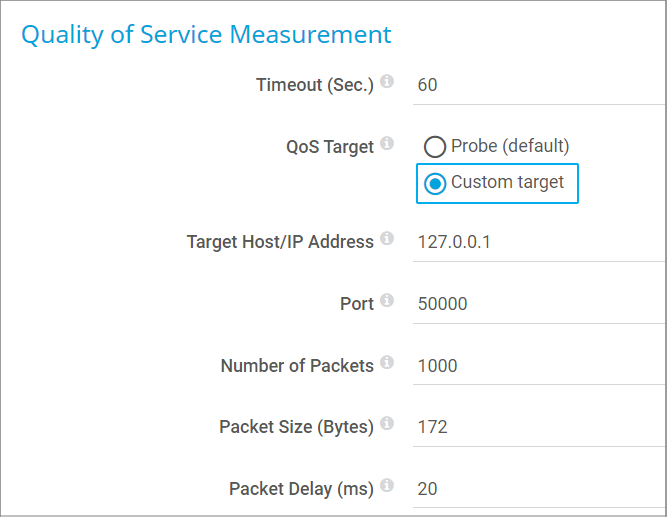
- In the sensor settings, select the option Custom target for QoS Target.
- In the Target Host/IP Address field, enter the IP address of the system on which the QoS Reflector script runs.
- The Port number must match the port that you use for calling the script (either the argument or the configuration file definition).
- You can leave all other settings unchanged.
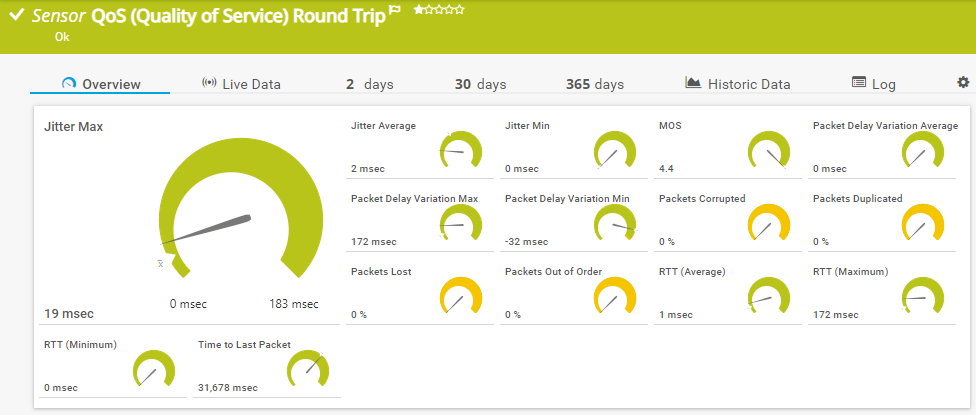
Wait a few moments and the sensor will show you its QoS measurements for the connection to and from the target device.
QoS Reflector on Windows systems
One of our customers successfully runs the QoS Reflector on Windows systems.
- In the QoS Reflector script, remove the first line that defines the interpreter:
#!/usr/bin/env python - Run the QoS Reflector from the command line and specify the Python interpreter as the application:
<your_path>\Python27\python.exe reflector.py --port 50000 --host All - Configure your QoS (Quality of Service) Round Trip sensor as described above.
Thank you, Jordan, for sharing this information!
Debugging
If you encounter any issues with your QoS Reflector, call the script with the parameter -d or --debug to get detailed information.
More
Created on Aug 14, 2014 4:52:07 PM by
Gerald Schoch [Paessler Support]
Last change on Jan 4, 2023 11:56:49 AM by
Brandy Greger [Paessler Support]
Votes:
1
Would be great to have this (reply function) interacting with Cisco IP SLA responder.
Votes:
0
Dear Stefan
Please allow me to ask you to clarify what exactly you mean.
We already have an SLA sensor:
https://www.paessler.com/manuals/prtg/cisco_ip_sla_sensor.htm
We also have two QoS sensors:
https://www.paessler.com/manuals/prtg/qos_quality_of_service_sensor.htm https://www.paessler.com/manuals/prtg/qos_quality_of_service_round_trip_sensor.htm
Are you missing any functions?
Votes:
0
Hi Having a few problems with this, which has been fine up till now! Before, we have been using Neorouter as a VPN between the server and the QoS reflector-which is a Raspberry Pi, the server is a WIN7 Pro machine. Worked great. Now we have decided to open up both firewalls at each end, and use the QoS script in the "raw", so to speak, to see if any improvement is made (due to VPN overhead etc). For the life of me,I cannot get it to work-both the Pi is DMZ'd (it sits behind a NAT's router in a remote site) and the Windows server is also DMZ'd. The script works, as if I set up another server on the same local network as the Pi sits on, the server comes back all "green". The Windows firewall is off as well.If I move it all back to going across the VPN, it all starts working again! I can only think the UDP packets as being lost somewhere, without the VPN in place.If a put in place a Port Monitor sensor (RDP 3899) or a ICMP ping, these all work as well! It only seems to be the QoS script that has the problem?
Thanks
cabs
Votes:
0
Cabs,
without knowing your infrastructure troubleshooting is hard in your scenario.
Do you have any device in place which has a UDP flood protection which is configured?
Best regards
Votes:
0
Hello,
I'd like a little clarification on how the probe generates udp packets from its monitored device. I cannot guarantee qos markings from my probe to an end point, and I'd rather have two endpoints measure qos between each other. They are both linux so I'd prefer to have a mini probe on one end and the reflector on the other end, and the results sent back to the prtg probe/core. Is this possible?
Votes:
0
Dear solly989,
Unfortunately, this is not possible. This functionality is not implemented in the source code of a mini probe. You will have to use either a local probe or remote probe.
Best,
Sebastian
Votes:
0
When doing tcpdumps on the reflector server I noticed that the response port is always 50000 instead of the sources port that initiated the connection, is this normal and is there a way to have it respond back to the same port?
Setup:
PRTG Server 10.1.1.100 ( pointed to reflector on port 50000 using custom ) > Firewall > Reflector Server 10.0.0.50 ( set to run on port 50000 )
TCP Dump:
02:20:35.752042 IP 10.1.1.100.46706 > 10.0.0.50.50000: UDP, length 127 02:20:35.752178 IP 10.0.0.50.50000 > 10.1.1.100.50000: UDP, length 127
Explanation:
This works fine when the reflector is on the same subnet because there's nothing to potentially block communication between both servers other than their OS firewall. However, if you have them on different subnets or in different offices which then transverse a firewall, we have issues because the dynamic port established by the source PRTG server is not used to communicate back from the destination reflector server to the source. This means the firewall can't automatically allow communication from the source to and from the destination because the ip and port source/destinations don't match.
I'm not used to working with UDP that much but most the packet captures I've seen for UDP and certainly for TCP will reuse the initiator source port for continued communications back and forth. By not doing so it's having to open a new session to the original initiator which may not have inbound NAT or security allowances for that communication.
Votes:
0
Since my first reply is not active yet, I want to update. I turned on the --nat option and did see the ports as expected however the PRTG sensor is showing it errored out still and I confirmed it is getting the responses via a packet capture on the PRTG server.
Is there a way to get PRTG to work with the NAT option enabled?
Votes:
0
Hi wolfjlupus,
Please contact us directly via support@paessler.com and provide us with a couple of information about your current sensor configuration. Please attach a screenshot of the sensor's Overview, Log and Settings tab and make sure to cover the entire PRTG interface when creating the screenshots.
Thank you very much in advance.
Sebastian


Add comment