What is this?

This knowledgebase contains questions and answers about PRTG Network Monitor and network monitoring in general.

Learn more

PRTG Network Monitor

Intuitive to Use. Easy to manage.
More than 500,000 users rely on Paessler PRTG every day. Find out how you can reduce cost, increase QoS and ease planning, as well.

Free Download

Top Tags


View all Tags

Why is my SNMP HPE ProLiant System Health sensor in the error status after updating PRTG?

Votes:

0

After installing the PRTG update to version 14.4.12, the SNMP HPE ProLiant System Health sensor is suddenly showing the Down status on several systems at the same time. The error message is Error in Overall Status: 'Failed'.

Why does this error suddenly appear? What can I do to solve this HPE ProLiant error?

14-4-12 error error-messages failed hp proliant prtg systemhealth update

Created on Oct 21, 2014 1:48:17 PM by  Johannes Herrmann [Paessler Support] (1,360) 2 2

Last change on Jan 4, 2023 12:18:08 PM by  Brandy Greger [Paessler Support]


32 Replies

Accepted Answer

Votes:

0

This article applies as of PRTG 22

SNMP HPE ProLiant System Health sensor and the "Error in overall status" after PRTG update

With the update to PRTG 14.4.12, we changed the method that the SNMP HPE ProLiant System Health sensor uses to determine the Overall Status channel. A new OID checks for more possible error cases, so the sensor now detects errors that it could not show before. This is the reason why you might suddenly see the Down status for your HPE ProLiant servers after updating PRTG. PRTG works as expected and correctly reports that there is something wrong.

Check the detected error on your HPE server

Log in to the web interface System Management Homepage of your HPE Server. On top of the Home page, you see an indicator that shows you that your system has a problem. Next to it, you see the Component Status Summary that shows you which parts of your system are affected.

Here is an example that shows an error in the Integrated Management Log (IML):
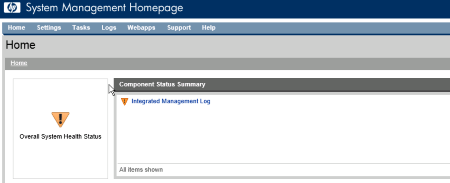
HPE IML
Click to enlarge.

Troubleshooting solutions

Option 1: Correct the error on your HPE ProLiant server

After reading the log and correcting the error, you have to clear the IML from the command line:

  1. Get access to the logs: ipmiutil sel -N [Host IP Address] -U [User Name] -P [Password] -F HP
  2. Clear the logs: ipmiutil sel -d -V 4 -N [Host IP Address] -U [User name] -P [Password] -F HP
  3. Delete the content of IML: "C:\Program Files\Compaq\Cpqimlv\cpqimlv.exe" /export:"c:\iml.txt" /clear

Option 2: Change the sensor's behavior in PRTG


Note: With the following instructions you configure your HPE sensors to ignore the status information that HPE gives you.


2a: Deactivate checking the overall status

You can deactivate checking the overall status so that the respective channel does not show the Down status at all.

Click the Overall Status channel to open the channel settings. Under Lookup, select None to completely disable alerting for this channel.

2b: Use an alternate lookup file for the sensor

If you do not want to have a rigorous Down status for this sensor using the new OID, you can redefine the sensor behavior by selecting an alternate lookup file.

Click the Overall Status channel to open the channel settings. Under Lookup, select the lookup file prtg.standardlookups.hp.statuswarning.ovl. The default lookup file is prtg.standardlookups.hp.status.ovl.

2c: Customize the default lookup file for the sensor

You can also redefine the sensor behavior in the respective default lookup file that is used for the sensor's Overall Status channel.

  • Go to the \lookups folder in your PRTG program directory and copy the file prtg.standardlookups.hp.status.ovl into the \lookups\custom folder.
  • Open your copy in an editor.
  • In the lookup definition, change state="Error" to state="Warning" and save your settings.
  • This will cause the sensor to show the Warning status instead of the Down status if your HPE hardware reports an error.
  • As long as your custom file exists, PRTG prefers your customizations to the original lookup settings.
  • For details, see PRTG Manual: Define Lookups, section Customizing Lookups.

Note: In PRTG 15.x.16 through 18.1.37, there was an IML status channel. As of PRTG 18.1.38, this channel no longer exists.

Created on Oct 21, 2014 2:04:40 PM by  Johannes Herrmann [Paessler Support] (1,360) 2 2

Last change on Jan 4, 2023 12:18:54 PM by  Brandy Greger [Paessler Support]


Votes:

2

We have the same problem, the sensor shows 'Failed', but on the SMH everything is fine. So it`s not a problem on the HP Server.

Update: some old entries in the IML were the reason

Created on Oct 23, 2014 12:48:05 PM

Last change on Oct 27, 2014 8:49:44 AM by  Torsten Lindner [Paessler Support]


Votes:

1

Please use the SNMP Tester and run a "Custom OID" test with this oid:

1.3.6.1.4.1.232.6.2.11.2.0

If it returns a 4, the Integrated Management Log is causing the failure state. If it returns a 2 the IML is working correctly.

If the IML is working correctly, please run this "Custom OID":

1.3.6.1.4.1.232.6.2.7.1.0

If it returns a 4, the POST error recording feature is causing the failure state. If it returns a 2 the POST error recording feature is working correctly.

Created on Oct 23, 2014 3:13:42 PM by  Johannes Herrmann [Paessler Support] (1,360) 2 2

Last change on Nov 19, 2014 4:38:47 PM by  Johannes Herrmann [Paessler Support] (1,360) 2 2


Votes:

0

Hmm. Our "Critical Errors" according to HP SMH are that some of the spare network sockets are not in use...!

Created on Oct 24, 2014 7:48:14 AM


Votes:

0

All our ILO's are down since this update! Disabling the complete health sensor by setting it to 'warning' is no solution because it is only the Overall state that is "failed", we cannot miss warning on fans and temperatures. Please have a fix for this. Spare sockets not in use??

Created on Oct 26, 2014 6:02:41 AM


Votes:

0

Would it be possible to provide us with the exact error message you are getting possibly with a screenshot?

Created on Oct 27, 2014 9:03:42 AM by  Greg Campion [Paessler Support]


Votes:

0

This sucks. 29 of our SNMP ProLiant Health Sensors in error state since updating to 14.4.x. Check in Integrated Management Log: Overall System Status is OK.

Created on Oct 27, 2014 11:21:43 AM


Votes:

0

Herman

If you use the SNMP tester as Johannes mentions above does it return a 4?

Created on Oct 27, 2014 12:25:33 PM by  Greg Campion [Paessler Support]


Votes:

0

For the record.... this update broke all of my Proliant sensors as well. I've not had a chance to investigate further - I had to pause them for now. Gotta say, this was a first for me. My PRTG updates are always rock solid.

I am still getting the error after clearing the IML log

Created on Oct 28, 2014 5:52:25 PM

Last change on Oct 29, 2014 1:38:18 PM by  Patrick Hutter [Paessler Support] (7,225) 3 3


Votes:

1

I cleared the Integrated Management Log as mentioned above to resolve this.

Created on Oct 28, 2014 6:08:09 PM


Votes:

0

I faced the same issue, but I found that I can clear old logs by using the following command -

"C:\Program Files\Compaq\Cpqimlv\cpqimlv.exe" /clear

Paessler need to have SNMP trap for logs on older servers.

Thanks for the help in the right direction.

Cheers

Created on Nov 3, 2014 3:07:34 PM


Votes:

0

I had to clear IML Log in ILO to get the SNMP HP System Health Sensor green again.

BUT because not all network ports are used, It always creates an inl entry that the port is down. Can anybody tell me how to avoid that? We have the same problem with hp insight manager, sends emails all the time. Thats why we wanted to get rid of it and use PRTG.

Admin hot happy

cheers

Created on Nov 4, 2014 3:23:40 PM


Votes:

1

the commando "C:\Program Files\Compaq\Cpqimlv\cpqimlv.exe" /clear worked perfectly!

Created on Nov 5, 2014 9:23:11 AM


Votes:

0

I am having the same issue as described above. I ran the command to clear the IML. That worked, but did not clear my issue. I did the SNMP test with the first OID and got a response of 4. So I did the SNMP test on the 2nd OID and got a response of 1. Since this does not match the 2 responses that you listed and it is still not working I believe there is the issue. I looked at the SMH on the HP server and all is Green.

The server in question was rebooted on 11/22. The PRTG server was rebooted last week. None of the channels in the sensor show anything.

Created on Dec 3, 2014 3:02:58 PM

Last change on Dec 4, 2014 8:07:23 AM by  Torsten Lindner [Paessler Support]


Votes:

0

Is there any other channel in a error state? The CPU fan for example? You could try to restart the entire server which might help to get rid of those errors :)

Created on Dec 3, 2014 3:10:12 PM by  Stephan Linke [Paessler Support]


Votes:

0

All of the channels in this sensor have no information. All other sensors on this server are Green. The server was rebooted on 11/22/2014 for Windows updates. At that time the latest version of HP System Management was also installed. This is a production server so rebooting it right no is not an option. I have rebooted the PRTG server and that did not resolve anything either. I currently have 3 servers that are reporting like this one. All of my other HP servers are reporting correctly in PRTG.

Created on Dec 3, 2014 3:37:25 PM


Votes:

0

Please try to restart the SNMP agents: /etc/init.d/hp-snmp-agents restart

Does this bring remedy? :)

Created on Dec 5, 2014 1:52:38 PM by  Stephan Linke [Paessler Support]


Votes:

0

From our side the same problem, we have around 50 of these sensors, all of them did go into error after installing update 14.4.12.3510+ (overal status failed)

For the sensors which were monitoring linux systems it was sufficient to clear the iml log via the ilo console, this cleared the down status for these sensors.

For the sensors which are installed on windows systems, clearing the IML logs doesn't seem to solve the issue, neither does restarting the HP Systems Management Agents. On all affected sensors installed on windows systems the CPU Fan has a status of "other", I don't know however if this is causing the "down status" of the sensor.

Paessler mentioned that they have reworked the sensor to update the behaviour with the latest HP update, so we have done a test case, installing the latest proliant support pack on an HP Proliant ML 110, the installed version of the HP systems management agents is 10.0.0.0
Installing the updated proliant support pack, including the updated HP Systems management Agents did not resolve the issue. We performed a second test by removing the sensor on the server and re-adding it, and then the situation gets even worse. Before removal we had the following channels with status:

CPU Fan Status	3	Other	Other	Other	
Disk Controller Status	41	OK	OK	OK	
Downtime	-4		 	 	
Fans Broken	5	0 #	0 #	0 #	
Fans Running	4	0 #	0 #	0 #	
Fault Tolerant Fans Broken	7	0 #	0 #	0 #	
Fault Tolerant Fans Running	6	6 #	6 #	6 #	
Overall Status	0	Failed	OK	Failed	
Power Consumption 1	33	55 W	50 W	90 W	
Power Consumption 1 (%)	34	12 %	11 %	20 %	
Power Consumption 2	37	65 W	60 W	100 W	
Power Consumption 2 (%)	38	14 %	13 %	22 %	
Power Supply 1 Condition	36	OK	OK	OK	
Power Supply 1 Status	35	No Error	No Error	No Error	
Power Supply 2 Condition	40	OK	OK	Failed	
Power Supply 2 Status	39	No Error	No Error	General Failure	
System Fan Status	2	OK	OK	OK	
Temperature 01(ambient)	8	24 °C	18 °C	27 °C	
Temperature 02(cpu)	9	40 °C	40 °C	40 °C	
Temperature 03(cpu)	10	40 °C	40 °C	40 °C	
Temperature 04(memory)	11	27 °C	23 °C	36 °C	
Temperature 05(memory)	12	27 °C	22 °C	36 °C	
Temperature 06(memory)	13	31 °C	26 °C	38 °C	
Temperature 07(memory)	14	32 °C	27 °C	40 °C	
Temperature 08(powerSupply)	15	43 °C	39 °C	45 °C	
Temperature 09(powerSupply)	16	35 °C	31 °C	37 °C	
Temperature 10(system)	17	43 °C	38 °C	46 °C	
Temperature 11(system)	18	32 °C	28 °C	36 °C	
Temperature 12(system)	19	39 °C	35 °C	44 °C	
Temperature 13(ioBoard)	20	32 °C	27 °C	35 °C	
Temperature 14(ioBoard)	21	33 °C	29 °C	36 °C	
Temperature 15(ioBoard)	22	32 °C	28 °C	35 °C	
Temperature 19(system)	23	22 °C	18 °C	26 °C	
Temperature 20(system)	24	28 °C	24 °C	31 °C	
Temperature 21(system)	25	28 °C	24 °C	31 °C	
Temperature 22(system)	26	29 °C	24 °C	31 °C	
Temperature 23(system)	27	38 °C	33 °C	40 °C	
Temperature 24(system)	28	33 °C	28 °C	35 °C	
Temperature 25(system)	29	32 °C	28 °C	34 °C	
Temperature 26(system)	30	32 °C	28 °C	34 °C	
Temperature 29(storage)	31	35 °C	35 °C	35 °C	
Temperature 30(system)	32	67 °C	59 °C	70 °C	
Thermal Status

After the removal and re-addition of the sensor, only the following channels appeared again, all without status:

CPU Fan Status	3	Other	Other	Other	
Disk Controller Status	8	OK	OK	OK	
Downtime	-4		 	 	
Fans Broken	5	0 #	0 #	0 #	
Fans Running	4	0 #	0 #	0 #	
Fault Tolerant Fans Broken	7	0 #	0 #	0 #	
Fault Tolerant Fans Running	6	0 #	0 #	0 #	
Overall Status	0	Failed	Failed	Failed	
System Fan Status	2	OK	OK	OK	
Thermal Status

We hope that paessler can repair this sensor, as in our environment this was one of the key sensors to justify the investment on this product.

Created on Dec 9, 2014 7:45:32 AM

Last change on Sep 1, 2015 11:37:44 AM by  Luciano Lingnau [Paessler]


Votes:

0

Hi Ronny,

Sorry to hear that the update broke your windows server monitoring. The CPU state being "other" is indeed causing the sensor to error. This could be caused by a cold reset or any other unexpected shutdown. Could you try it with one server to completely reboot it and see if that fixes the error?

There's actually nothing on our end that we could do about it - we needed to switch to that OID since the old one we've used became obsolete with the latest HP version. So it's either having no monitoring or more detailed monitoring - of course, we went for more details, but since our testing systems were in a state where the IML was empty and no other errors, we didn't think this would cause such trouble.

Created on Dec 9, 2014 8:32:11 AM by  Stephan Linke [Paessler Support]


Votes:

1

I found another solution to the IML issue. Run the IML interface, select all entries and mark them repaired.

According to this site there's a way to do it from the command line, but it's not a one-liner. http://h30499.www3.hp.com/t5/ITRC-HP-Systems-Insight-Manager/Clearing-IML-entries/td-p/3252551#.VI3MjTctB34

-- Ken

Created on Dec 14, 2014 6:13:09 PM


Votes:

1

Hello.

I had the same problem.

  • Run "C: \ Program Files \ Compaq \ Cpqimlv \ cpqimlv.exe"
  • Keep a backup of the log. Menu "Log ---> Save Log as ..."
  • Once saved, should be emptied. Menu "Log -> Clear All Entries ..."

Once these tasks, it has worked sensor.

Greetings

Created on Feb 19, 2015 12:43:59 PM

Last change on Sep 1, 2015 11:38:26 AM by  Luciano Lingnau [Paessler]


Votes:

0

Clearing the IML worked for me. Thanks!

Created on Feb 25, 2015 3:38:53 PM


Votes:

0

Hello,

I am experiencing a similar issue to the above. I have installed redundant power supplies in 2 of my HP ProLiant servers this past weekend, and since then my PRTG installation is telling me that PSU1 on each of the servers is in a degraded state.

I check the iLo System health page on both of the servers and it tells me that the power supplies are perfectly ok and fully redundant. I have cleared the IML logs on both the servers but this has not resolved the issue.

I then ran your SNMP Tester utility (v5.1.3) using the custom OID's above. The first gives a result of 2, so the IML appears to be working correctly. The second custom OID gives me a result of 1. What does this indicate please?

Created on Mar 25, 2015 3:54:41 PM


Votes:

0

Hi Paragon,

Sometimes restarting the target server redeems issues like this - can you try that? :)


Regards

Created on Mar 26, 2015 7:53:13 AM by  Stephan Linke [Paessler Support]

Last change on Mar 26, 2015 7:53:21 AM by  Stephan Linke [Paessler Support]


Votes:

0

The 2 servers are both live production servers, so not easily restartable. I will attempt to find some downtime to do so. In the meantime, can you tell me what the response of 1 to the second custom OID means please?

Many thanks,

Created on Mar 26, 2015 9:43:44 AM


Votes:

0

Hehe okay, not so easy then. The integers represent the following states:

  1. Other
  2. Ok
  3. Degraded
  4. Failed

Created on Mar 26, 2015 10:40:42 AM by  Stephan Linke [Paessler Support]


Votes:

0

The problem with this thread is that YES, clearing the IML will make the sensor go back into a good status. However, every time the server is rebooted(and all of the NICs are not plugged, for example) "errors" show up in the IML and the status goes back to Down. Why is it not possible to simply disable an individual channel? This would solve our problems as we see value in the rest of what the sensor does, but not this IML noise we can safely ignore.

Has there been any progress anyone can report on this? It's such a massive annoyance that all one can do is clear the log manually.

Created on Nov 2, 2015 3:42:49 PM


Votes:

0

Hiya,

You can simply click on this particular channel and set the lookup to None. This will prevent the senor from switching its status.

Best regards, Felix

Created on Nov 2, 2015 6:53:05 PM by  Felix Saure [Paessler Support]


Votes:

1

Hi Agent_Mulder

I had the same problem, but updating the ILO and System management (approx the whole Proliant) did the trick. I also had a second Raid Controller in one server, where no HD were attached. I had to disable it to get all green in PRTG.

From my side I would say that the behavior of PRTG is correct, showing errors when IML is having errors. I mean you want to KNOW if your server has errors.

regards Thomas

Created on Nov 3, 2015 10:08:46 AM


Votes:

0

After changing the lookup behaviour (e.g. from Error to None) to suppress this channel, additionally you will need to Reload the definition as described in the linked resource. Afterwards, a new check will need to be performed before the new value is reflected in the sensor status.

  • You can (re)load the defined lookups in the custom folder by clicking the Load Lookups button in the PRTG web interface under Setup | System Administration | Administrative Tools.
  • A sensor whose lookup file you have modified and reloaded will not re-evaluate this lookup before the next sensor scan. For sensors with large scanning intervals, use the Scan Now option from the context menu to immediately apply the new lookup definition and to avoid an incorrect sensor status.

Created on Sep 11, 2018 11:13:49 AM


Votes:

1

Hi,

Six years later this issue is still really annoying, it took us days to figure out that this was an error logged into IML logs which put this sensor's Overall Status down...

@passler : Can you please update this sensor's documentation with this known issue ? It could save a lot of time for futur HP's servers admins. ;)

Regards,

Clément

Created on Jan 4, 2021 10:41:22 AM


Votes:

0

Hello Clément,

I will propose this to our team. Since it isn't issue in PRTG, it could be possible that we won't add it into our documentation.


Kind regards

Felix Wiesneth - Team Tech Support

Created on Jan 5, 2021 8:52:24 AM by  Felix Wiesneth [Paessler Support]


Disclaimer: The information in the Paessler Knowledge Base comes without warranty of any kind. Use at your own risk. Before applying any instructions please exercise proper system administrator housekeeping. You must make sure that a proper backup of all your data is available.