What is this?

This knowledgebase contains questions and answers about PRTG Network Monitor and network monitoring in general.

Learn more

PRTG Network Monitor

Intuitive to Use. Easy to manage.
More than 500,000 users rely on Paessler PRTG every day. Find out how you can reduce cost, increase QoS and ease planning, as well.

Free Download

Top Tags


View all Tags

Why does my Synology System Health sensor show incorrect CPU and memory values?

Votes:

0

I monitor my Synology NAS with the SNMP Synology System Health sensor. Unfortunately, comparing to the Synology resource monitor interface, both the sensor channels CPU Load and Memory Free show wrong values while, for example, the temperature is correct. CPU load usage even exceeds 100% in PRTG.

Where do these values come from? Which OIDs does the SNMP Synology System Health sensor query to display CPU and memory percentages? Does PRTG do some sort of calculation?

cpu-load incorrect memory nas prtg snmp snmp-sensor synology system-health value

Created on Feb 13, 2015 3:50:31 PM by  Gerald Schoch [Paessler Support]

Last change on Jan 4, 2023 1:00:20 PM by  Brandy Greger [Paessler Support]


5 Replies

Accepted Answer

Votes:

1

This article applies as of PRTG 22

Monitoring Synology CPU load and memory usage

The SNMP Synology System Health sensor shows, among other values, CPU load and memory usage in percent to indicate the health status of your Synology Network Attached Storage (NAS). For this purpose, PRTG does the following:

  • For the CPU Load channel, the sensor shows the 1-minute load in percent.
  • For the Memory Free channel, the sensor uses the following formula: Memory Usage = memTotalFree / (memTotalSwap + memTotalReal)

The way PRTG calculates the memory usage for your Synology device explains potential differences to the memory values you might see in the resource monitor GUI of your Synology. This cannot be changed.

For CPU load, consider the following: Synology reports the 1-minute average load as a dimensionless number and sums up the CPU load of the single cores. This means that the maximum load that Synology returns is not 100% but 100% multiplied by the number of CPU cores in the Synology station. Because of this, you can even see CPU load values that are over 100% in PRTG.

We cannot adjust the CPU load display of the SNMP Synlogy System Health sensor to automatically adapt to the number of CPU cores because the according information of the Synology device is missing. However, you can change the way the CPU load channel displays the value.

Workaround for Synology CPU load display

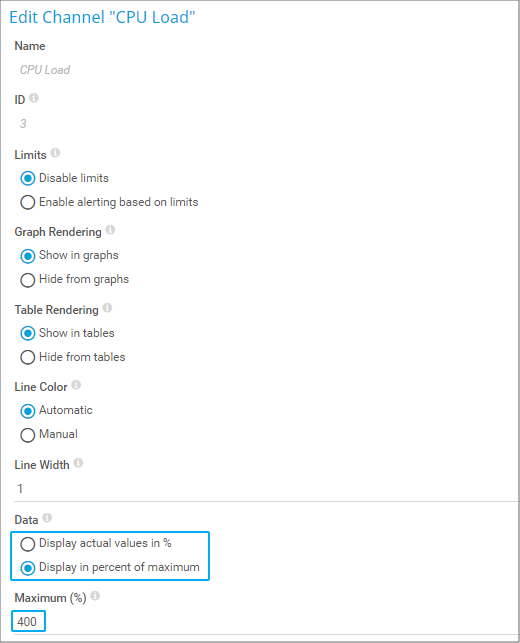
With the knowledge from above, you can adjust the display of the CPU load value of your Synology System Health sensor depending on the number of existing CPU cores. So if your Synology NAS has four CPU cores, you can show the percentage of the maximum 100*4 in the channel.

  1. Navigate to the Overview tab of your SNMP Synology System Health sensor.
  2. Open the channel settings of the CPU Load channel.
  3. In section Data, select the option Display in percent of maximum.
  4. In the appearing Maximum (%) field, enter the result of 100 multiplied by the number of CPU cores. In this example, it would be 400.
  5. Click OK to save the settings.

Settings
Click to enlarge.

The percentage value of the CPU Load channel now matches your Synology CPU load average based on a scale of 0 to 4 cores having 0 to 100% CPU load.
Created on Feb 13, 2015 4:16:07 PM by  Gerald Schoch [Paessler Support]

Last change on Jan 4, 2023 1:01:00 PM by  Brandy Greger [Paessler Support]


Votes:

5

Synology (among many other linux operating systems) uses memory for disk caching, and the PRTG Sensor's Available Memory is taken from the Free memory listed on your Synology Device. You can check this by going to your Synology's UI, Main Menu, Resource Monitor, Performance, and Memory (tab).

As for the CPU, I don't think the Synology UI accurately reports the CPU usage. At first glance, the divide by 4 method still reported CPU usage much higher than the Synology's resource monitor reports right on the landing page of the Synology UI. In actuality, the CPU usage seems to fluctuate when idle a lot. I do agree with setting the max to 400% unless you just want to read that info as total processing power, but if you ssh into your Synology and run htop, you get a much more detailed report of CPU usage per core. I was satisfied with the prtg sensor after seeing this.

Created on Feb 25, 2015 8:08:23 PM


Votes:

0

I have been playing around with CPU monitoring on synology devices and I don´t like the way chosen OID works. I believe you are using (.1.3.6.1.4.1.2021.10.1.5.1) which is described as "System load average within the last 1 minute".

In my opinion, CPU in Synology system health sensor is pretty sloppy, even dividing by 4.

I think it is better monitored by the sum of (.1.3.6.1.4.1.2021.11.9.0 "The percentage of CPU time spent processing user-level code") and (.1.3.6.1.4.1.2021.11.10.0 "The percentage of CPU time spent processing system-level code, calculated over the last minute").

Another option is the formula 100 - the value of (.1.3.6.1.4.1.2021.11.11.0 "The percentage of processor time spent idle, calculated over the last minute")

OIDs are taken from https://global.download.synology.com/download/Document/Software/DeveloperGuide/Firmware/DSM/All/enu/Synology_DiskStation_MIB_Guide.pdf

Created on Dec 16, 2019 7:26:11 PM


Votes:

0

Hi there,

"I believe you are using (.1.3.6.1.4.1.2021.10.1.5.1) which is described as "System load average within the last 1 minute"
--> Yes, we use this one.

About the OIDs you've mentioned:
1.3.6.1.4.1.2021.11.9:
Quote: "The percentage of CPU time spent processing user-level code, calculated over the last minute. This object has been deprecated in favour of 'ssCpuRawUser(1.3.6.1.4.1.2021.11.9.50)', which can be used to calculate the same metric, but over any desired time period."

1.3.6.1.4.1.2021.11.11:
Quote: "The percentage of processor time spent idle, calculated over the last minute. This object has been deprecated in favour of 'ssCpuRawIdle(1.3.6.1.4.1.2021.11.53)', which can be used to calculate the same metric, but over any desired time period."

Now it may be the case that the information might be outdated from circitor.fr, usually it is a quite reliable source, I would recommend to check if you actually get those values from the OIDs you've mentioned. You can use our SNMP Tester with option "Walk" on OID 1.3.6.1.4.1.2021.11 to see what you're getting. If you get data for the desired OIDs, you can of course create your own sensor querying whatever you want from your NAS by using SNMP Custom Advanced Sensor for example.

Kind regards,

Erhard

Created on Dec 17, 2019 7:52:58 AM by  Erhard Mikulik [Paessler Support]


Votes:

0

My Synology with 2 cores showing max CPU utilization of 1,049% brought me here.

I believe ($0 search engine education, like everyone else I suppose) that 2021.10.1.5.1 as a "load average" is basically the average number of processes waiting for CPU time over the time interval--one minute in this case. As such it has no relation to CPU "percentages".

Most people are going to be used to seeing load averages as a decimal value like 0.15 or 2.34 or something. Of course SNMP has some difficulties with non-integer numbers so they multiply it by 100 and round it off to an integer. This multiplication by 100 could understandably lead to thinking about percentages.

If I may suggest a fix...hmm, how about two options, either of which would fix this in my opinion:

Option 1: divide the value by 100 and get rid of the percent sign, leaving it as a unit-less value. This would match what people are used to for typical Linux system load values.

Option 2: Change the channel name to "CPU idle time" and the OID to 1.3.6.1.4.1.2021.11.11. Or if you can do 100 minus the value returned, the name could be "CPU utilization" or whatever.

But in its current state this channel seems to not match any monitoring industry conventions that I have ever seen.

Created on Jan 13, 2021 7:46:17 PM


Disclaimer: The information in the Paessler Knowledge Base comes without warranty of any kind. Use at your own risk. Before applying any instructions please exercise proper system administrator housekeeping. You must make sure that a proper backup of all your data is available.