This article applies as of PRTG 22
Summarized sensor and channel states in the Business Process sensor
The Business Process sensor allows you to get an overall status of a whole business process while monitoring several involved process components.
This makes the sensor a powerful and also very flexible tool.
While administrators are generally interested in the states and data of every process component, employees of a company that are less technically inclined often do not need to see more than the summarized status of a process to know if it works or not. For example, an accounting manager is okay with the information “Our website works fine”, whereas a business infrastructure manager prefers to get exact information about the involved web servers, databases, and other hardware and applications.
This article describes how the Business Process sensor calculates summarized sensor and channel states from the states of single monitored objects.
1. States of monitored objects
With the Business Process sensor, you can create individual sensor channels from the monitoring objects that you have in your network. You can select single sensors or whole devices, groups, or probes for a specific business process channel.
Every object in a channel has its own status that contributes to the overall status of this channel.
The sensor decides for every monitoring object if it is in an "up" or "down" condition.
Note: The "up" and "down" conditions are different from the Up and Down states of a sensor. This is necessary for the sensor to be able to calculate summarized states. Have a look at the following table to see which sensor status leads to which Business Process (BP) condition.
| Channel object status | (BP) condition | Reason: Why does a given sensor status correspond to a given BP condition? |
|---|
| Up | Up | The monitored object works. |
|---|
| Warning | Up | The sensor may show a warning, but the monitored object works. |
|---|
| Down (Partial) | Up | This status is available in a cluster setup and is displayed if at least one cluster node reports that the sensor shows the Up status and at least one cluster node reports that the sensor shows the Down status. With at least one report stating the Up status, the monitored object is supposed to be working. |
|---|
| Unusual | Up | The sensor may show unusual values, but the monitored object works. |
|---|
| Collecting | Up | The sensor is still waiting for more monitoring data to definitively decide on the sensor status, but so far the monitored object works. This PRTG-internal status is visualized as Unknown in the PRTG web interface. |
|---|
| Down | Down | The monitored object does not work. |
|---|
| Unknown | Down | The sensor does not know if the monitored object works, for example because it has not yet received any data or because it has not received any data for a certain amount of time. |
|---|
| None | Down | The sensor has not received any monitoring data from the monitored object yet. This PRTG-internal status is visualized as Unknown in the PRTG web interface. |
|---|
| Paused | Down | The monitored object does not work and monitoring has been paused, for example actively by the user, by inheritance, or by executed schedules. |
|---|
| Acknowledged | Down | The monitored object does not work and someone already knows about it. |
|---|
2. Summarized channel states
The Business Process sensor calculates the percentage of the "up" and "down" conditions per channel.

Click to enlarge.
For example, the channel Core Server Security contains 75 % of sensors that are in an "up" condition.
25 % Up Status + 25 % Warning Status + 25 % Warning Status = 75 % BP Up Condition
25 % of all sensors are in a "down" condition.
25 % Down Status = 25 % BP Down Condition
With individual error and warning thresholds, you can define the limits for the Up, Warning, and Down states for every channel.
Define the threshold in %.
This is what the sensor does to check which overall channel status it has to display:
Step 1
Calculate the percentage of "up" conditions of a channel based on the objects it contains. As a result, you could translate this into the statement: “x % of the monitored objects work fine.”
Step 2
Compare the calculated value for the "up" conditions of a channel to the Error threshold.
- Set the channel status to Down if the calculated percentage of "up" conditions of a channel is below the indicated error limit. The question to answer is: “Do x % of the monitored objects work ok?” If the answer is no, then the channel will be in a "down" condition.
- If 2.1 does not result in the Down status and the answer is yes, go on with step 3 and check the warning threshold.
Step 3
Compare the calculated value for the "up" conditions of a channel to the Warning threshold.
- Set the channel status to Warning if the calculated percentage of "up" conditions of a channel is lower than the indicated warning limit. The question to answer is: “Do x % of the monitored objects work ok?” If the answer is no, the channel will be in a "warning" condition.
- If 3.1 does not result in the Warning status and the answer is yes, set the channel status to Up.
Note: If the indicated threshold points exactly to the borderline between two states, the sensor displays the more positive status. For example, if you enter 75 as a warning limit and you have 3 sensors in the Up status (75%) and 1 sensor in the Down status (25%), the sensor channel displays the Up status, not the Warning status because 75 % of the monitored objects work ok.
Example A:
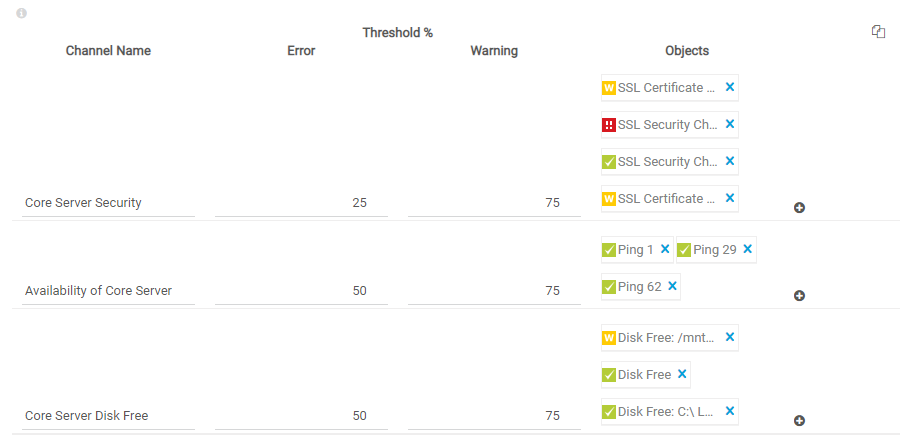
If these are your settings…

Click to enlarge.
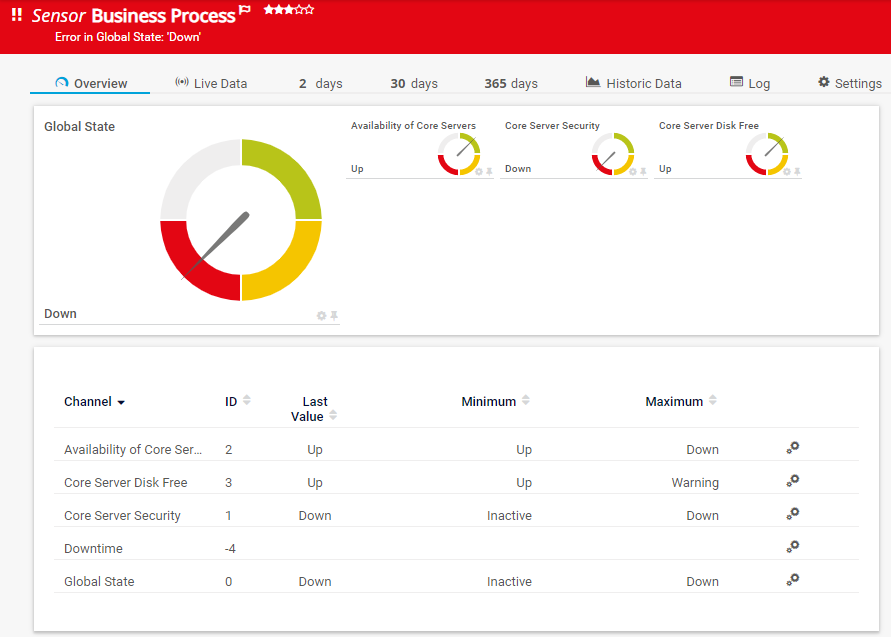
... this will be your result:

Click to enlarge.
The reason is that you have 50 % of objects in the Up status and 50 % of objects in the Down status in your channel and your error limit is 51 %. The sensor checks “Do 51 % of the objects work ok?” and the answer is no. Because of this, the Core Server Security channel displays the Down status.
If you set an error threshold of 50%, the sensor would check if 50% of the monitoring objects work ok. The answer would be yes and consequently, the sensor would show the Up status.
Example B
If these are your settings…

Click to enlarge.
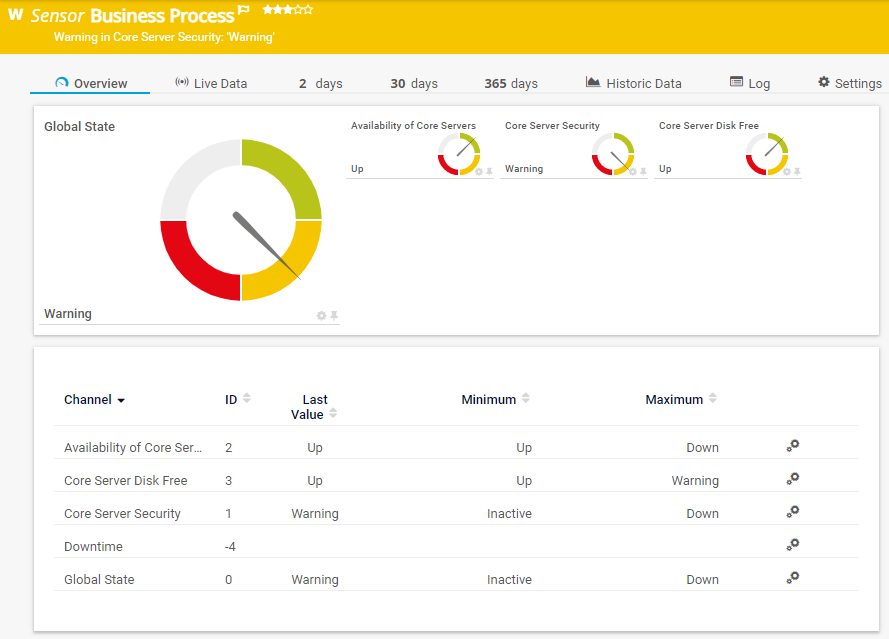
... this will be your result:

Click to enlarge.
The reason is that you have 75 % of objects in the Up status and 25 % of objects in the Down status in your channel and your warning limit is 76 %. The sensor checks “Do 76 % of the objects work ok?” and the answer is no. Because of this, the Core Server Security channel shows the Warning status, but not the Down status because 50 % of the sensors work fine.
Channel weight of monitoring objects
Note: Every object in a channel has equal weight or importance, no matter if it is a sensor, device, group, or probe. If you want to give double weight or importance to an object, add it to the channel twice. If you want to give triple weight to it, add it three times.
In the following example, the SSL Security Check (Port 443) 16 sensor is added twice and has double weight.
The Core Server Security channel contains 80 % of sensors that show the Up status.
2 * 20 % Up Status + 2 * 20 % Warning Status = 80 % BP Up Condition
20 % of all sensors show the Unknown status.
20 % Unknown Status = 20 % BP Down Condition
Consequently, the overall Core Server Security channel status is Up, because 80 % of the sensors work fine and at least 61 % of the sensors have to work fine to not trigger the Warning status.
3. The global business process status
The Global State channel is the default primary channel of the Business Process sensor and summarizes the states of the individual channels. It always shows the status that all channels have or, if not all of the channels are in the same status condition, the “most alarming” status that one of the individual channels has.
For example, the Global State channel in Example B above shows the Warning status because one of the individual channels, the Core Server Security channel, shows the Warning status, too. Example A shows the Down status because one of the channels, the Core Server Security channel again, shows the Down status.
Generally, the sensor can have the following sensor states:
- Unknown (gray)
- Up (green)
- Warning (yellow)
- Down (red)

The order from the least alarming to the most alarming sensor status is the following:
(Unknown Status) < Up Status < Warning Status < Down Status
More
Add comment