This article applies to PRTG Network Monitor 15.4.20 or later
Monitoring the Business Process “Website Back End”: A Use Case for the Business Process Sensor
The Business Process sensor is a very flexible and powerful tool. It is very flexible because you can create individual channels with data from any element belonging to your network and to your business process in line. The sensor is also powerful because it gives you an overall status that is valid for a whole business process and valuable for many colleagues, since it summarizes detailed monitoring results for different process components.
While system administrators are generally interested in the states and data of every process component, less technical employees of a company often do not need to see more than the summarized status of a process to know if it works or not. For example, an accounting manager is okay with the information “Our website works fine”, whereas a business infrastructure manager prefers to get exact information about the involved web servers or databases and other hardware.
This article describes how you could set up a basic Business Process sensor for the sample use case Website Monitoring.
Note: For the use case in this article we narrow down the potential complexity of website monitoring and limit it to the website back end.
1. Define Your Monitoring Goals
By monitoring the business process “Website Back End” you want to
- get the overall information if the systems behind your website work or not at a glance,
- be able, at the same time, to have a closer look at the individual involved process components.
This is possible with PRTG! So let’s start setting up an appropriate business process monitoring.
2. Set Up the Monitoring of Your Website Back End
You want your customers to get a smooth and successful website surfing experience, especially if your website comprises also a more complex process like an online shop. Therefore, you need perfectly working systems behind your website.
Imagine that you add the following website infrastructure devices to your network and to your monitoring:
- 1 Load Balancer that distributes incoming requests to your web servers in an intelligent way to balance the load optimally,
- 4 web servers that handle the requests made by your customers,
- 2 devices providing the resources for your high performance database to store and process data, which are, in the case of an online shop, for example your customers’ orders.
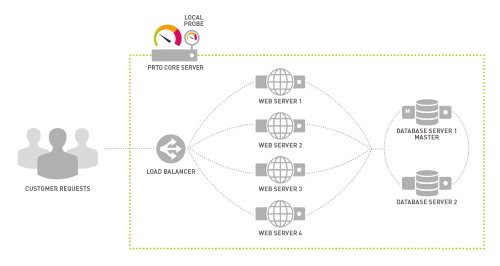 Enlarge here.
2.1 Insert the Business Process in Your Monitoring
The PRTG device tree gives you a good overview of your network structure and the devices you have.
- Choose an appropriate probe and group to place the devices that are involved in the business process you want to monitor. Then create the sensors you need to monitor your website back end.
Note: Creating a dedicated group for your business process is not obligatory. However, it gives you a nice overview.
- As well, select a device on which you want to create the Business Process sensor or add a new device which is particularly dedicated to your business process. When creating and setting up the Business Process sensor for your website back end, you will need the sensors that you created before.
The group for your online shop business process could look like this:
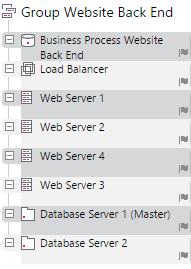
2.2 Set Up a Detailed Monitoring of Website Back End
To optimally monitor your online shop infrastructure, choose adequate sensors from the available sensor types for PRTG Network Monitor and add them to the corresponding devices you created before. You can use, for example,
2.3 Set Up the Business Process Sensor for Your Website Back End
After setting up the detailed monitoring of the involved website back end components, you can now start to set up the summarized monitoring for your business process.
- Select an appropriate device and add the Business Process sensor to it. From the list of sensors proposed by PRTG in the Add Sensor dialog, choose the Business Process sensor.

- The next steps are all about sensor settings. We focus on the Business Process Specific settings here.
- With the help of the following table, define your individual business process specific settings.
 Enlarge here.
- Define your channels. You are entirely free in determining what you want to count as a process component and which sensors, devices, groups, or even probes are part of it. In the case of your website back end, you can define the channels according to the devices you have and the applications you run on them.
For example, create the channels Load Balancer, Web Servers, and Database.
 Enlarge here.
- According to the number of monitoring objects in your channels, set individual error and warning thresholds. For example, in our case, an error threshold of 50 % in the Web Servers channel means that at least 2 web servers are required to work, and if not, the sensor will go in a down status. The warning threshold of 75 % indicates, that you want 3 web servers to work, and if not, the Business Process sensor will display a warning status because there is a warning in its Web Servers channel.
PRTG smart tricks: Thanks to business process settings like this, your colleagues and your boss, who eventually see the status on your company dashboards, will not have to worry until they really have to. The Business Process sensor will only show a down status when the whole business process is "severely in danger". Thanks to the PRTG notifications function, you as a system administrator, however, will be informed immediately as soon as one sensor indicates that there is something wrong with your systems.
Note: Please see the Knowledge Base article How does the Business Process sensor calculate summarized sensor states for comprehensive information on how you can set appropriate error and warning thresholds and what the corresponding sensor results are like!
2.4 Check Your Business Process Website Back End
The default primary channel Global State is a wrap-up of the overall channel states. It displays the most alarming status that any of the individual channels has.
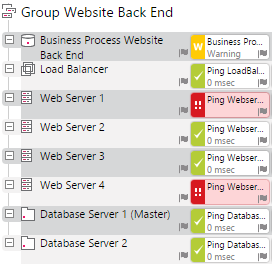
For example, if Web Server 1 and Web Server 4 do not work as expected, the Business Process sensor switches to a warning status as defined by the warning threshold in the Web Servers channel (see above).
If your website back end works fine, a glance at the green sensor overview is enough to know!
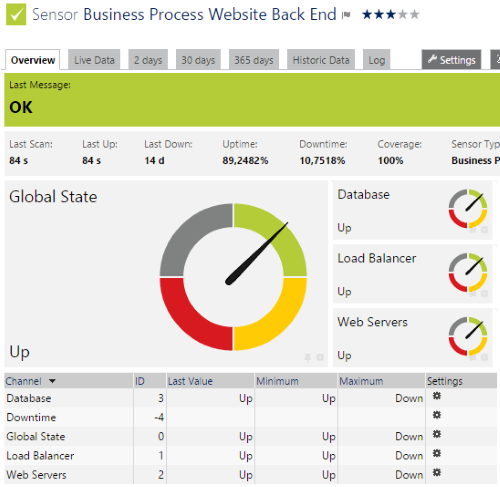 Enlarge here.
3. Thinking Further
- You want to include your website front end in your website monitoring? Have a look at the business process use case Website Front End in the Paessler Knowledge Base.
- Do you want to show the status of your business process directly on your company dashboards? No problem, put the sensor on your PRTG map!
- You need statistical data and/or historical data to show how your business process performed during a certain period of time? Create a report with PRTG!
- You monitor several business processes and want to see them all at a glance? Create a special view of your device tree with a business process library!
More


Add comment