This article applies to PRTG Network Monitor 15.4.20 or later
Monitoring the Business Process “Website Front End”: A Use Case for the Business Process Sensor
The Business Process sensor is a very flexible and powerful tool. It is very flexible because you can create individual channels with data from any element belonging to your network and to your business process in line. The sensor is also powerful because it gives you an overall status that is valid for a whole business process and valuable for many colleagues, since it summarizes detailed monitoring results for different process components.
While system administrators are generally interested in the exact states and data of every process component like involved servers or databases, less technical employees of a company often do not need to see more than the summarized status of a process to know if it works or not. For example, an accounting manager is okay with the information “Our website works fine”.
This article describes how you could set up a basic Business Process sensor for the sample use case Website Monitoring.
Note: For the use case in this article we narrow down the potential complexity of website monitoring and limit it to the website front end. Please see 3. Thinking Further below to get more ideas also for complex website monitoring.
1. Define Your Monitoring Goals
By monitoring the business process “Website” you want to
- get the overall information if your website front end works or not at a glance, making sure that your website visitors can surf it smoothly,
- be able, at the same time, to have a closer look at some individual involved process components.
This is possible with PRTG! So let’s start setting up an appropriate business process monitoring for your website front end.
2. Set Up the Monitoring of Your Website Front End
An attractive and well working website is essential for every company. Your website might consist of more static pages and also of pages including dynamic elements and all kinds of media types. If you have a more complex website, offering whole transactions like, for example, an online shop, you also have to ensure that your customers can follow sequences of URLs successfully.
2.1 Insert the Business Process in Your Monitoring with PRTG
The PRTG device tree gives you a good overview of your network structure and the devices you have:
- Choose an appropriate probe and group to place the devices that are involved in the business process you want to monitor. Then create the sensors you need to monitor your website.
Note: Creating a dedicated group for your business process is not obligatory. However, it gives you a nice overview.
- As well, select a device on which you want to create the Business Process sensor or add a new device which is particularly dedicated to your business process. When creating and setting up the Business Process sensor for your website, you will need these sensors that you created before.
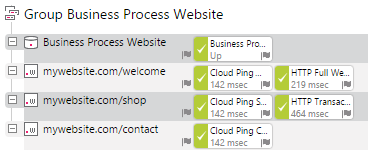
Imagine that 3 of your website pages are particularly important for you:
- The welcome page: You know that the first impression counts a lot and that’s why you created a nice welcome page for your visitors. It contains texts, videos, images, and all kinds of elements for an attractive user experience on your website.
- The shop page: This is the main page of your online shop and of course, you want to guarantee its availability 24/7.
- The contact page: You implemented a contact form and want to ensure that your visitors and potential customers will always be able to contact you.
PRTG comes with several sensors that serve your website monitoring needs. For example:
- To monitor the general availability and loading times from different continents around the globe, use the Cloud Ping Sensor. Remember that you can direct the sensor’s behavior (regarding up, warning, or down status) by setting individual limits for webpage loading times in the sensor's channels.
- To ensure that your welcome page is fully loaded, including all page elements, in a reasonable amount of time, you can use the HTTP Full Web Page sensor.
Note: This sensor can increase the load for your monitoring systems, so please create it for the most important web pages only and use it carefully keeping an eye on your system performance.
- A customer shopping on your website often visits a sequence of webpages and sends a sequence of HTTP requests to the server. You can monitor if these transactions are successful with the HTTP Transaction sensor. Find out how to use the free Paessler URL Recorder to configure the HTTP Transaction sensor in the Paessler Knowledge Base.
The group for your website business process could look like this:
2.2 Set Up the Business Process Sensor for Your Website Front End
Now you have all the monitoring information you need to feed the Business Process sensor.
- Choose it from the list of sensors proposed by PRTG in the Add Sensor dialog and add it to an appropriate device.

- The next steps are all about sensor settings. We focus on the Business Process Specific settings here.
- With the help of the following table, define your individual business process specific settings.
 Enlarge here.
- Define your channels. You are entirely free in determining what you want to count as a process component and which sensors, devices, groups, or even probes are part of it. In the case of your website front end, create, for example, the channels General Availability & Loading Times and Shop Transaction. By default, the sensor will later also show the primary channel Global State that summarizes your individual channels.
 Enlarge here.
- According to the number of monitoring objects in your channels, set individual error and warning thresholds. For example, in our case, an error threshold of 40 % in the General Availability & Loading Times channel means that at least 2 sensors are required to display an up condition, and if not, the sensor will go in a down status. The warning threshold of 80 % indicates, that you want 4 sensors to be in an up condition, and if not, the Business Process sensor will display a warning status. As you can see, the Cloud Ping sensor for your shop page is added twice to the General Availability & Loading Times channel. This way, you can give it double weight if you consider it twice as important as the Cloud Ping to your welcome and contact page.
Note: Please see the Knowledge Base article How does the Business Process sensor calculate summarized sensor states? for comprehensive information on how you can set appropriate error and warning thresholds and what the corresponding sensor results are like!
2.3 Check Your Business Process Website Front End
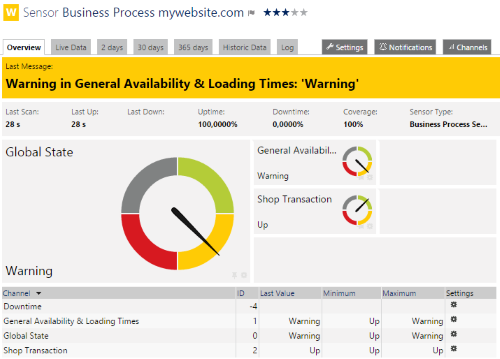
The default primary channel Global State is a wrap-up of the overall channel states. It displays the most alarming status that any of the individual channels has.
For example, if 3 business process monitoring objects do not work as expected, the Business Process sensor switches to a warning status as defined by the warning threshold in the General Availability & Loading Times channel (see above).
 Enlarge here.
Take a closer look at the sensor’s channels to know which parts of your website need your attention.
 Enlarge here.
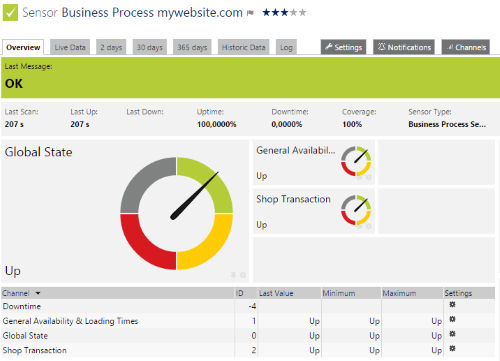
If your website works fine, a glance at the green sensor overview is enough to know!
 Enlarge here.
3. Thinking Further
Discover further monitoring possibilities with PRTG Network Monitor and get inspiration for your individual monitoring needs!
3.1 More Website Monitoring
Do you wish to monitor a more complex website? You can also use the following sensors:
3.2 Profit From Other PRTG Features
- Do you want to show the status of your business process directly on your company dashboards? No problem, put the sensor on your PRTG map!
- You need historical data to show how your business process performed during a certain period of time? Create a report with PRTG!
- You monitor several business processes and want to see them all at a glance? Create a special view of your device tree with a business process library!
More


Add comment