Can this be done with PRTG? How to monitor the status of FRU's(Field Replaceable Units) from my Cisco device using PRTG?
Best Answer
Votes:
1
This article applies to PRTG Network Monitor 16.3.25 or later
Yes, it is possible to monitor the Status of your device's Field Replaceable Units using PRTG. We've published a compatible device template, which can be used to automate the deployment of these custom sensors using auto-discovery.
The sensors will monitor the following FRU Properties:
- Power Supplies
- Operational Status
- Administrative Status
- Fans and Fan Trays
- Operational Status
- Modules
- Operational Status
- Administrative Status
- Uptime
Requirements
- PRTG Network Monitor 16.3.25 or later;
- Since the Device Template relies on the auto-discovery process, the device you want to monitor needs to be reachable via ping;
- SNMP must be enabled/working and the device must support/implement the ENTITY-MIB(for naming) and CISCO-ENTITY-FRU-CONTROL-MIB (for state).
Known Issues/Limitations
- Due to the way that the underlying SNMP Custom Table sensor works and the way that Cisco makes the data available, the sensors deployed by this template may not work after a reboot/reset or firmware update of the monitored device. Technically speaking, the issue is that no index update is possible with the information available in the monitored tables. Please perform the discovery/deployment anew as required.
- This Device Template will mimic the alerts as reported by the monitored device via SNMP(via lookups), if the status is not reported correctly via SNMP, PRTG will not be able to pick up any issues.
- This device template is created based on data collected from other customers, we can not guarantee that the above described sensors will work on your systems. You use all components at your own risk.
Deployment/Usage
- Download the required zip-archive here.
- Extract the archive to the PRTG program directory. By default, this is %Program Files (x86)%\PRTG Network Monitor\. See the Paessler Knowledge Base to learn more about how and where PRTG stores its data.
- In the PRTG web interface, navigate to Setup | Administrative Tools and click Go! in the Restart Core Server section. This is to ensure that the MIB and lookups are loaded before doing the discovery.
- Create a new device in PRTG with the address (IP or FQDN) of the device that you want to monitor and configure its SNMP Credentials accordingly.
- Right-click your new device, select Run Auto Discovery With Template, and select the "Custom Cisco FRU v02" from the list. Note: Using the auto-discovery with a dedicated Device Template is convenient here because it automates the creation of the dedicated sensors organized in an SNMP Custom Table Sensor.
- The sensors should be deployed after a couple of seconds.
- You can adjust the channel limits or lookups to your needs later.
Result
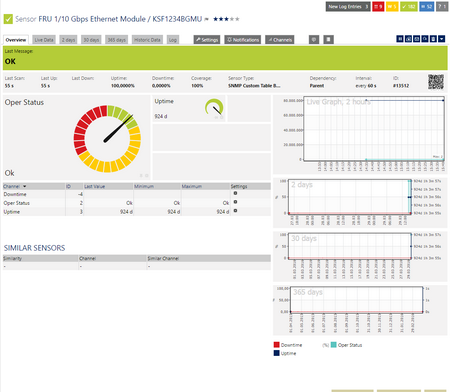
The resulting sensors will look like the one below:

No sensors deployed? :(
Please read ahead for troubleshooting.
Troubleshooting
Got any issues? Please don't hesitate to contact us by replying to this post or by contacting us via a support ticket. Please make sure to link/mention this KB-Post. Please read ahead for troubleshooting steps that you can perform in advance.
Auto-Discovery
Your Auto-Discovery log can tell you a lot about what went wrong during the sensor's deployment. It's possible to troubleshoot the auto-discovery by inspecting the auto-discovery log, if you get entries like the one below ( NOT FOUND) it means that the required OID's aren't available.
[...]
27.12.2016 12:18:54: Device ID: 22848 Name: nue-ws-011 EMULATOR@163 Host: somehost.somedomain.sometld
27.12.2016 12:18:54: Device Templates; Device ID: 22848; Selected: 1
27.12.2016 12:18:54: Template Loaded; Device ID: 22848; Name: Custom Cisco FRU v02
27.12.2016 12:18:55: Template Check; Device ID: 22848; Check ID: ping; FOUND
27.12.2016 12:18:56: Template Check; Device ID: 22848; Check ID: snmp; FOUND
27.12.2016 12:18:57: Template Check; Device ID: 22848; Check ID: entPhysicalTable; FOUND
27.12.2016 12:18:58: Template Check; Device ID: 22848; Check ID: snmp_cefcFRUPowerStatusTable; FOUND
27.12.2016 12:18:59: Template Check; Device ID: 22848; Check ID: snmp_cefcFRUFanTable; FOUND
27.12.2016 12:19:00: Template Check; Device ID: 22848; Check ID: snmp_cefcModuleTable; NOT FOUND
[...]
In the case above, we would expect to get the sensors for Fans and Power Supplies, but not for modules, as these were reported as NOT FOUND by the Auto-Discovery Process. This log would also tell you if the discovery was interrupted because the device didn't respond to Ping or to a basic snmp check.
SNMP Data
If the discovery log isn't sufficient, you can review the SNMP Data from your device directly. To do so, please refer to the information below. You should have this information at hand when contacting our Support Team. The text below (in the square) can be saved as .txt and used with the scan script option from our SNMP Tester. This will allow you to review which SNMP Queries succeed and which ones don't deliver any data.
entPhysicalTable
walk=1.3.6.1.2.1.47.1.1.1
----
cefcFRUPowerStatusTable
walk=1.3.6.1.4.1.9.9.117.1.1.2
cefcModuleTable
walk=1.3.6.1.4.1.9.9.117.1.2.1
cefcFanTrayStatusTable
walk=1.3.6.1.4.1.9.9.117.1.4.1
----
Best Regards,
Luciano Lingnau [Paessler Support]
Created on Dec 27, 2016 1:40:54 PM by
Luciano Lingnau [Paessler]
Last change on Jul 26, 2021 11:22:18 AM by
Maike Guba [Paessler Support]
(2,404)
●2
●1
6 Replies
Votes:
0
This article applies to PRTG Network Monitor 16.1.23 or later
Yes, it is possible to monitor your device's Field Replaceable Units Status using PRTG.
We've published a compatible device template, which can be used to automate the deployment of these sensors using auto-discovery. The sensors will report the FRU's status according to the provided lookup file and the module's Uptime (with no standard limit/warning), but that could be added in a new template.
Requirements
Since the Device Template relies on the auto-discovery process, the device you want to monitor needs to be reachable via ping.
This template will only work to monitor systems which are configured correctly (SNMP Working and responding to OID's from the entityMIB.mib(for naming) and ciscoEntityFRUControlMIB.mib(for state). The following OID's need to be 'walkable' via SNMP or your sensors won't be created.
- 1.3.6.1.4.1.9.9.117.1.2.1 (cefcModuleTable)
- 1.3.6.1.2.1.47.1.1.1 (entPhysicalTable)
It's possible to troubleshoot the auto-discovery by inspecting the auto-discovery log, if you get entries like the one below ( NOT FOUND) it means that the required OID's aren't available.
[...]
29.03.2016 14:33:25: Template Check; Device ID: 8362; Check ID: cefcModuleTable; FOUND
29.03.2016 14:33:26: Template Check; Device ID: 8362; Check ID: entPhysicalTable; NOT FOUND
[...]
Usage Instructions
You may download the required files here. Relevant files in this archive:
Custom Cisco FRU TableSensor.odt 	-> Device Template, to be copied to C:\Program Files (x86)\PRTG Network Monitor\devicetemplates\
prtg.custom.cisco.ModuleOperType.ovl	-> Lookup File, to be copied to C:\Program Files (x86)\PRTG Network Monitor\lookups\custom\
- Copy all files to the required destinations.
- Head to Setup > Administrative Tools and perform a "Load Lookups" operation.
- Create a new device in PRTG with the Address of the Cisco equipment that you want to monitor, configure the SNMP Credentials correctly.
- Right click on the device, select Run Auto Discovery With Template, select the 'Custom Cisco FRU TableSensor' from the list and proceed.
Channels limits or lookups may need to be adjusted for your needs after the sensor's creation.
Result
The resulting sensors will look like the one below:

Best Regards,
Created on Mar 23, 2016 10:15:55 AM by
Luciano Lingnau [Paessler]
Last change on Mar 30, 2016 11:12:48 AM by
Luciano Lingnau [Paessler]
Votes:
0
This Doesn't display the PSU status, even after attempting to modify the template to look up the "cefcfrupower status" oid, which looking in the MIB Importer is 1.3.6.1.4.1.9.9.117.1.1.2.1.2.
Votes:
0
Hello Ryan,
thank you for your post.
Instead of modifying the template, I would advise you to try and deploy a SNMP Custom Table sensor from scratch on the following Table OID:
| cefcFRUPowerStatusTable | 1.3.6.1.4.1.9.9.117.1.1.2 |
This will also allow you to confirm whenever this table exists/is reported by your device and contains any data.
However, please note that the standard SNMP Cisco System Health sensor will be able to monitor your device's power-supplies, there's no need for a custom sensor in this case.
Best Regards,
Luciano Lingnau [Paessler Support]
Votes:
1
This article applies to PRTG Network Monitor 16.3.25 or later
Yes, it is possible to monitor the Status of your device's Field Replaceable Units using PRTG. We've published a compatible device template, which can be used to automate the deployment of these custom sensors using auto-discovery.
The sensors will monitor the following FRU Properties:
- Power Supplies
- Operational Status
- Administrative Status
- Fans and Fan Trays
- Operational Status
- Modules
- Operational Status
- Administrative Status
- Uptime
Requirements
- PRTG Network Monitor 16.3.25 or later;
- Since the Device Template relies on the auto-discovery process, the device you want to monitor needs to be reachable via ping;
- SNMP must be enabled/working and the device must support/implement the ENTITY-MIB(for naming) and CISCO-ENTITY-FRU-CONTROL-MIB (for state).
Known Issues/Limitations
- Due to the way that the underlying SNMP Custom Table sensor works and the way that Cisco makes the data available, the sensors deployed by this template may not work after a reboot/reset or firmware update of the monitored device. Technically speaking, the issue is that no index update is possible with the information available in the monitored tables. Please perform the discovery/deployment anew as required.
- This Device Template will mimic the alerts as reported by the monitored device via SNMP(via lookups), if the status is not reported correctly via SNMP, PRTG will not be able to pick up any issues.
- This device template is created based on data collected from other customers, we can not guarantee that the above described sensors will work on your systems. You use all components at your own risk.
Deployment/Usage
- Download the required zip-archive here.
- Extract the archive to the PRTG program directory. By default, this is %Program Files (x86)%\PRTG Network Monitor\. See the Paessler Knowledge Base to learn more about how and where PRTG stores its data.
- In the PRTG web interface, navigate to Setup | Administrative Tools and click Go! in the Restart Core Server section. This is to ensure that the MIB and lookups are loaded before doing the discovery.
- Create a new device in PRTG with the address (IP or FQDN) of the device that you want to monitor and configure its SNMP Credentials accordingly.
- Right-click your new device, select Run Auto Discovery With Template, and select the "Custom Cisco FRU v02" from the list. Note: Using the auto-discovery with a dedicated Device Template is convenient here because it automates the creation of the dedicated sensors organized in an SNMP Custom Table Sensor.
- The sensors should be deployed after a couple of seconds.
- You can adjust the channel limits or lookups to your needs later.
Result
The resulting sensors will look like the one below:

No sensors deployed? :(
Please read ahead for troubleshooting.
Troubleshooting
Got any issues? Please don't hesitate to contact us by replying to this post or by contacting us via a support ticket. Please make sure to link/mention this KB-Post. Please read ahead for troubleshooting steps that you can perform in advance.
Auto-Discovery
Your Auto-Discovery log can tell you a lot about what went wrong during the sensor's deployment. It's possible to troubleshoot the auto-discovery by inspecting the auto-discovery log, if you get entries like the one below ( NOT FOUND) it means that the required OID's aren't available.
[...]
27.12.2016 12:18:54: Device ID: 22848 Name: nue-ws-011 EMULATOR@163 Host: somehost.somedomain.sometld
27.12.2016 12:18:54: Device Templates; Device ID: 22848; Selected: 1
27.12.2016 12:18:54: Template Loaded; Device ID: 22848; Name: Custom Cisco FRU v02
27.12.2016 12:18:55: Template Check; Device ID: 22848; Check ID: ping; FOUND
27.12.2016 12:18:56: Template Check; Device ID: 22848; Check ID: snmp; FOUND
27.12.2016 12:18:57: Template Check; Device ID: 22848; Check ID: entPhysicalTable; FOUND
27.12.2016 12:18:58: Template Check; Device ID: 22848; Check ID: snmp_cefcFRUPowerStatusTable; FOUND
27.12.2016 12:18:59: Template Check; Device ID: 22848; Check ID: snmp_cefcFRUFanTable; FOUND
27.12.2016 12:19:00: Template Check; Device ID: 22848; Check ID: snmp_cefcModuleTable; NOT FOUND
[...]
In the case above, we would expect to get the sensors for Fans and Power Supplies, but not for modules, as these were reported as NOT FOUND by the Auto-Discovery Process. This log would also tell you if the discovery was interrupted because the device didn't respond to Ping or to a basic snmp check.
SNMP Data
If the discovery log isn't sufficient, you can review the SNMP Data from your device directly. To do so, please refer to the information below. You should have this information at hand when contacting our Support Team. The text below (in the square) can be saved as .txt and used with the scan script option from our SNMP Tester. This will allow you to review which SNMP Queries succeed and which ones don't deliver any data.
entPhysicalTable
walk=1.3.6.1.2.1.47.1.1.1
----
cefcFRUPowerStatusTable
walk=1.3.6.1.4.1.9.9.117.1.1.2
cefcModuleTable
walk=1.3.6.1.4.1.9.9.117.1.2.1
cefcFanTrayStatusTable
walk=1.3.6.1.4.1.9.9.117.1.4.1
----
Best Regards,
Luciano Lingnau [Paessler Support]
Created on Dec 27, 2016 1:40:54 PM by
Luciano Lingnau [Paessler]
Last change on Jul 26, 2021 11:22:18 AM by
Maike Guba [Paessler Support]
(2,404)
●2
●1
Votes:
0
Hi guys. I have a problem with this template.
I done all like was wrote in instruction but I see problems in my PRTG dashboard. I see that after auto-discovery some sensors stay with error like "No such instance(SNMP error # 223). This problem only with sensors in which field "Table OID" equal 1.3.6.1.4.1.9.9.117.1.2.1.
With sensors "FRU Power supply ..." and "table OID" = 1.3.6.1.4.1.9.9.117.1.1.2 all ok. Could you help me please?
Created on Oct 1, 2017 2:02:40 PM
Last change on Oct 2, 2017 6:41:33 AM by
Luciano Lingnau [Paessler]
Votes:
0
The user dseroshtanov contacted us via E-mail. Upon reviewing the data the we've noticed that the device doesn't provide all the required entries from the cefcModuleTable.
Specifically, the device doesn't provide the cefcModuleUpTime (1.3.6.1.4.1.9.9.117.1.2.1.1.8) from the cefcModuleTable (1.3.6.1.4.1.9.9.117.1.2.1). Without that data the whole sensor will go into error.
Since the device in question is running a software image from 2014, our first recommendation is to update the device to a more recent software image.
Best Regards,
Luciano Lingnau [Paessler Support]
Add comment