Not Valid for PRTG Version 12 or Later!
PLEASE NOTE: The information in this article does not apply to PRTG Network Monitor 12 or later!
For details about cluster setup in PRTG 12 or later, please see:
PRTG Manual: Failover Cluster Configuration
This article applies to PRTG 8.
10 Steps to Set Up a PRTG Cluster
This article explains how to set up a cluster of two servers (master node and failover node) with PRTG Network Monitor 8.
Before Getting Started
Important: Before getting started, please make sure you've read the introduction: How do I set up a cluster in PRTG 8?
It contains important hints and preparation steps you should consider before proceeding. Additionally, you will find there links to instructions on how to set up other scenarios.
Scenario 3: You've Set Up Two PRTG 8 Installations Already, Each Running in Single Mode
Your aim: Combine two existing PRTG version 8 servers into one failover cluster. The cluster will take over the configuration of *one* server (the future master server); the configuration of the other server (the future failover node) will be discarded.
Step 1
Decide which of the two servers will become your "Master Node" server. The configuration of the master node will be applied to the future cluster. The configuration of the other server (the future "Failover Node") will be saved in a backup file, but cannot be used in the cluster.
| On “Master Node“ server | On “Failover Node“ server |
|---|
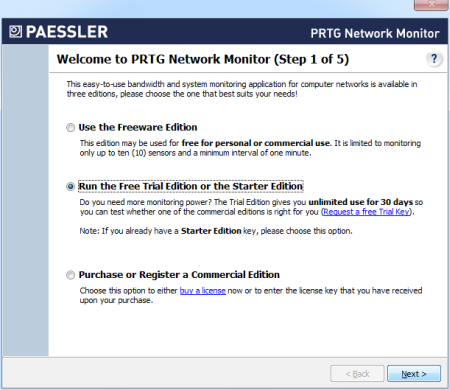
| On “Master Node“ server with the existing PRTG configuration you want to keep, execute the PRTG Network Monitor Setup program. Follow the installation wizard. This will update your installation to the current version. | — |
Step 2
| On “Master Node“ server | On “Failover Node“ server |
|---|
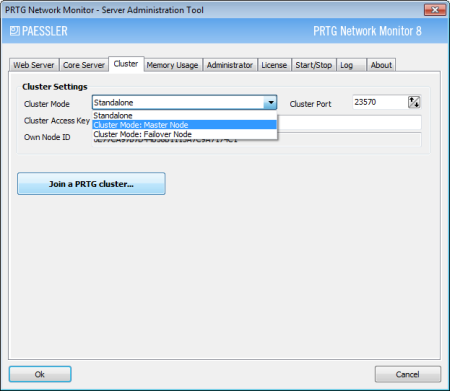
From the Start menu, open the PRTG Server Administrator program. In the Cluster tab, change the cluster mode from Standalone to Cluster Mode: Master Node.
A Cluster Access Key is automatically generated and does not have to be changed. You can leave the standard setting for Cluster Port. Save both cluster access key and port number in a text file for later use; you will need it in the cluster settings on “Failover Node“ server (step 4).
Confirm with OK and select Yes to restart the PRTG core server service. | — |
Step 3
| On “Master Node“ server | On “Failover Node“ server |
|---|
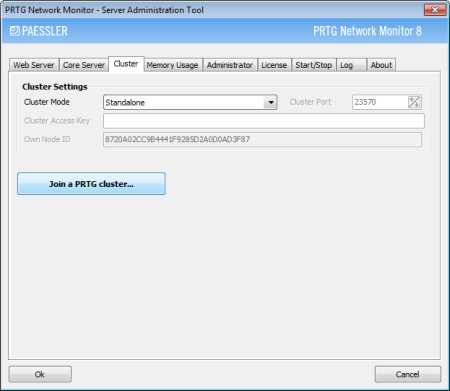
| — | On “Failover Node“ server, from the Start menu, open the PRTG Server Administrator program. In the Cluster tab, click on the Join a PRTG cluster... button.
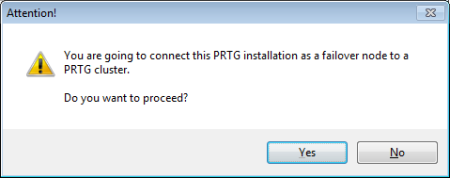
Confirm the upcoming warning with Yes.
You will finally see the cluster connection setup window. |
Step 4
| On “Master Node“ server | On “Failover Node“ server |
|---|
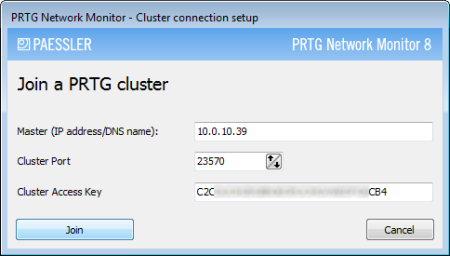
| — | In the Cluster Connection Setup window, in the Master field, enter the IP address or DNS name of the "Master Node" server. Also, fill in the Cluster Port and Cluster Access Key. You’ve saved this information before during setup on the “Master Node” server.
Click on Join. |
Step 5
| On “Master Node“ server | On “Failover Node“ server |
|---|
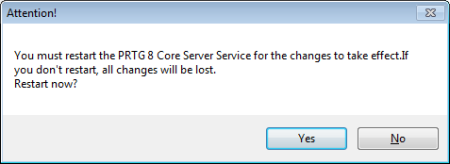
| — | Confirm the upcoming warning message with OK.
Click Yes to restart the PRTG core server service. Please wait a few seconds while the PRTG Windows services are restarted. |


Step 6
Time to take a deep breath. Continue with the next step.
Step 7
| On “Master Node“ server | On “Failover Node“ server |
|---|
Now you need to confirm the new failover node by setting it to Active in the master node's settings.
In a browser window, log into PRTG’s web interface of the “Master Node” server.
Choose Setup (screwdriver symbol) | System Administration | System Setup from the main menu and click on the Cluster Settings tab. You will see your “Master Node” server in the first line of the cluster list and your “Failover Node” server below.
For the “Failover Node”, set the radio button for Node State to Active and save the changes. The nodes will now connect and exchange configuration data. This may take a few minutes. | — |

Step 8
| For “Master Node“ server and for “Failover Node“ server |
|---|
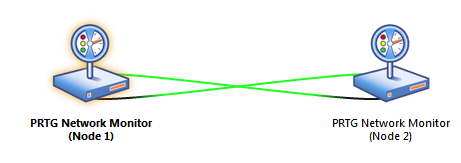
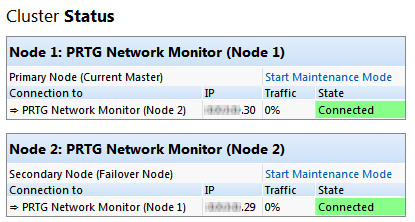
| In two browser windows, log into PRTG’s web interfaces of both of your PRTG installations. Open the cluster status page in both windows by clicking on the narrow cluster information bars at the top of each window. You should see a cluster status with your two nodes in a Connected state after a few minutes. |
Step 9
Having any problems? If your nodes cannot connect, please see
- the Cluster Log entries on the cluster status page of the web interface
- the core server log file, a text file in the logs directory of your PRTG installation (see How PRTG Network Monitor Stores its Data).
In the latest entries of these logs, you can see messages about any errors that might have occurred. These will give you hints on where to find a solution.
If you encounter connection problems between the two cluster nodes, please make sure that no software- or hardware firewall is blocking communication on the cluster port defined during cluster setup. Communication between the nodes must be possible in both directions in order for the cluster to work properly.
Step 10: Done!
That’s it. You’ve now successfully set up your failover cluster. All devices that are created or moved under the Cluster Probe will be monitored by both servers.
In order to monitor your existing configuration via all cluster nodes, on your master node, please move your groups, devices, and sensors from the local probe to the cluster probe! Objects including their settings will then automatically be transferred to all cluster nodes.
Please repeat Step 3 to Step 9 for each additional standalone installation you want to integrate into your cluster. For setting up nodes as new installations, please see the other scenarios.
See Also
Not Valid for PRTG Version 12 or Later!
PLEASE NOTE: The information in this article does not apply to PRTG Network Monitor 12 or later!
For details about cluster setup in PRTG 12 or later, please see:
PRTG Manual: Failover Cluster Configuration
Add comment