I use the Microsoft Cluster Service (MSCS) and want to know which node the active one in the cluster is. Can PRTG help me to find this out?
12 Replies
Votes:
2
This article applies to PRTG Network Monitor 16 or later
Monitoring Active Cluster Nodes With PRTG
Yes, you can find out which node is the active one in your Microsoft Cluster Service (MSCS) cluster. Just use the EXE Script Advanced Sensor that PRTG offers out-of-the-box, and an appropriate custom lookup file.
The following example illustrates how to do so, using a simple two node file & print cluster, running on Microsoft Server 2012 R2.
Note: The same method should work for any service that uses Microsoft Clustering, including SQL Server. It should also work with clusters with more than two nodes, with appropriate changes to the script and lookup files.
Note: Please understand that we cannot provide any support for custom scripts.
Prerequisites
- Make sure all systems are configured to work with PowerShell based sensors. Get more information in the PowerShell sensors FAQ.
- In particular, make sure the execution policy is set to allow scripts to execute, but complies with your own internal security policies. In this example, the policy is set to unrestricted. This needs to be done for the version of PowerShell that is invoked by PRTG, which may not necessarily be the version that appears on the Start Menu. If this is not done, you will probably get an Unauthorized Access error on the sensor.
- To fix this, on the PRTG core server or remote probe system where you want want to create the sensor, open a command shell as an Administrator (not a PowerShell session) and type the following:
%systemroot%\SysWOW64\WindowsPowerShell\v1.0\powershell.exe - When the command prompt changes to PS, enter the following command:
set-executionpolicy unrestricted - You can now close the command shell.
Create Your Active Cluster Node Sensor – Step by Step
Step 1
- Open a new text file.
- The following script uses a PowerShell WMI call to retrieve the name of the active cluster node. It then selects the last digit of the name (the cluster nodes in this example are called Clust01 and Clust02) and returns it, XML formatted, to PRTG.
Copy the following entries to your new text file:
$Node = Get-WmiObject -Class Win32_computersystem -ComputerName filecluster | Select-Object -ExpandProperty Name
$value = $Node.substring($Node.length - 1, 1)
$xml_txt = "<prtg>`n"+
                  "`t<result>`n"+
                  "`t`t<channel>Active Cluster Node</channel>`n"+
                  "`t`t<value>"+$value+"</value>`n"+
                  "`t</result>`n"+
                  "</prtg>`n"
Write-Host $xml_txt
Note: Please edit the ComputerName value (filecluster in the example above) on the first line to match the name of the cluster virtual name on your own system.
- Save the file as ClusterNode.ps1 in the \PRTG Network Monitor\Custom Sensors\EXEXML folder of the server where the sensor is to be created (local or remote probe system). Find more information about how and where PRTG stores its data in the Paessler Knowledge Base.
Step 2
- Open a new text file.
- This following script is the PRTG lookup file that converts the script payload into a meaningful text label, by comparing the script return (1 or 2) and returning the name of the corresponding cluster node.
Copy the following entries to your new text file:
<?xml version="1.0" encoding="UTF-8"?>
  <ValueLookup id="clusternode" desiredValue="1" xmlns:xsi="http://www.w3.org/2001/XMLSchema-instance" xsi:noNamespaceSchemaLocation="PaeValueLookup2.xsd">
    <Lookups>
      <SingleInt state="OK" value="1">
        Clust01
      </SingleInt>
      <SingleInt state="Ok" value="2">
        Clust02
      </SingleInt>
    </Lookups>
  </ValueLookup>
Note: The value in the <ValueLookup ID= > tag (clusternode in the example above) must match the name of the OVL file.
- Save the file in the \PRTG Network Monitor\lookups\custom folder of the PRTG server as clusternode.ovl.
- Reload your lookups or restart the PRTG server so new lookup definitions show up in the selection box. This is important for the next steps.
Step 3
- In PRTG, go to your Virtual Cluster Node device. If you have not created a device for your cluster node yet, please do so by adding a device.
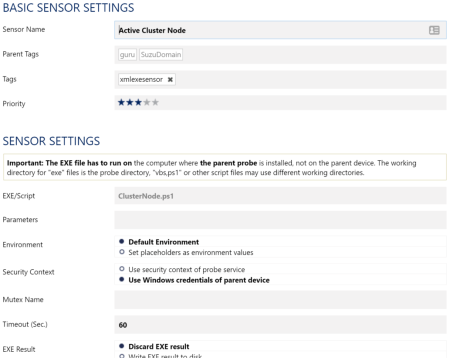
- Add a new sensor to your PRTG installation and choose the EXE/Script Advanced sensor.
- In the sensor settings, choose ClusterNode.ps1 as the relevant EXE/Script from the dropdown menu.

Click here to enlarge.
Note: After adding the sensor, force a couple of poll cycles to make sure the script is working.
Step 4
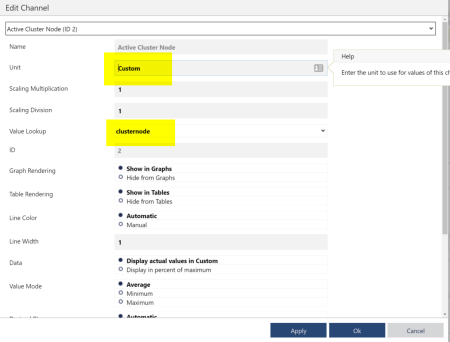
- Edit your sensor’s channel settings:
- Change the Unit to Custom.
- Select ClusterNode as the ValueLookup:

Click here to enlarge.
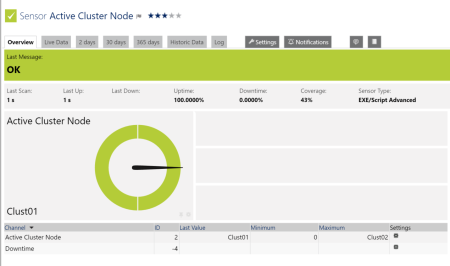
The sensor will reflect any changes to the active cluster node and now looks like this:

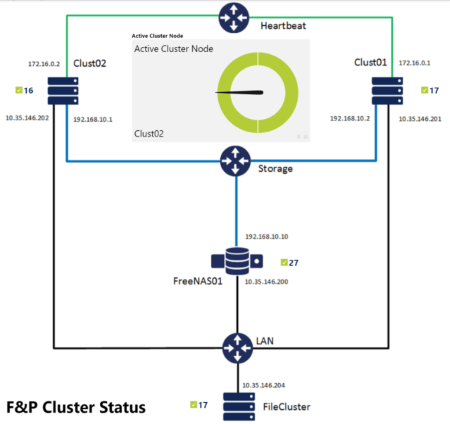
Step 5 (Optional)
You can add your sensor to a map to give an immediate visual indication of which node is currently active:

More
- You like scripting your own sensors? PRTG offers some more custom sensor types!
- More individualizing and visualizing: How maps in PRTG help you present your data at a glance! Here are some examples of how we use them at Paessler:
Created on Oct 6, 2016 4:05:55 PM by
Martina Wittmann [Paessler Support]
Last change on Dec 8, 2017 12:21:23 PM by
Brandy Greger [Paessler Support]
Votes:
0
Excellent detailing. can you please answer by below queries 1. Even after doing all settings correctly unable to see last value as "Clust01" in value field. This value is see in column name but not in value field. Due to this we cannot set notifications properly due to change in active node. please help here. I had pasted my columns for details. See the value 0 in this. It should have been "Clust01" as seen in column. Right?
Date Time 	       Active Cluster Node (Clust01)	Downtime	Coverage
7/3/2018 6:25:25 PM	0	                                        0 %	        100 %
7/3/2018 6:24:55 PM	0	                                        0 %	        100 %
7/3/2018 6:24:25 PM	0	                                        0 %	        100 %
Created on Jul 3, 2018 12:56:46 PM
Last change on Jul 3, 2018 1:00:24 PM by
Erhard Mikulik [Paessler Support]
Votes:
0
Hi there,
Have you created and added the lookup file as described in the guide under "Step 2" and "Step 4"?
Best regards.
Votes:
0
Hi Dariusz,
Thanks for your question.
Yes for sure right on the first time. You see in above logs "Clust01" is seen in Column name. If I would not have added the lookup value this should not have been populated. Right?
The issue is "values not getting populated in table". Due to absence of values we cannot set notifications for the same. Hope this input helps further to analyse the issue from your end.
Best Regards, Dusane Team,
Votes:
0
Hi there,
Unfortunately, not. Could you forward us some screenshots and the sensor results? Please activate the "Write EXE result to disk" option in the sensor's settings and forward us the log files (Result of Sensor XXX.Data.txt and Result of Sensor XXX.txt) located on the corresponding probe under "C:\ProgramData\Paessler\PRTG Network Monitor\Logs (Sensors)".
Please forward us the screenshots and sensor results to "support@paessler.com" by referencing to the Ticket ID PAE1058597.
Best regards.
Votes:
0
Hi there,
thanks for putting this together! I just worked my way through it, but the sensor stays in a warning state with the following note:
Warning by lookup value 'Undefined lookup value (0)' in channel 'Active Cluster Node'
I double checked both skripts, but can't find mistakes. Any suggestions?
Thanks for helping Marcel
Votes:
0
Hi there,
What Names do your cluster nodes have? Is it possible that the active one ends in a "0"?
Best regards.
Votes:
0
Hi Dariusz,
my modes are ending with -01 and -02.
For my understanding the error appears, because there ist nothing set for boolean value 0 in the clusternode.ovl file!? If i change <SingleInt state="Ok" value="2"> to <SingleInt state="Ok" value="0"> the sensor changes to green. But then i just drained roles to the second cluster node and the sensor didn't respond or change in any way.
Greets
Votes:
0
Hi there,
Please run the test manually and check what you get back. Additionally, run the following script instead:
$Node = Get-WmiObject -Class Win32_computersystem -ComputerName filecluster | Select-Object -ExpandProperty Name
$value = $Node
$Node
What result do you get there?
Best regards.
Votes:
0
Thanks for the quick respond.
The additional script correctly gives back the name of the active cluster node 02. Running the ClusterNode.ps1 manually, sets the value "2", which should point to node 02 in the lookup file. The sensor still wants to lookup a value "0".
Votes:
0
Hi there,
I suspect an error when the script is executed via PRTG. Please use the script above together with PRTG, activate the sensor logs and post the sensor result for a better analysis.
Best regards.
Votes:
0
Hi there,
sorry for the late response. First line of the sensor log cleared things up. My PRTG service account wasn't allowed to retrieve WMI informations from the nodes... Fixed that and the sensor shows the active node just as intended.
Thanks!
Add comment