This article applies as of PRTG 19
Configuration of SQL v2 sensors
There are a couple of SQL sensor types available in PRTG:
The setup for all SQL sensors is roughly the same.
In this example, we will cover the MySQL v2 sensor, but the steps apply to the other SQL sensor types as well. This guide will assist you in migrating from the deprecated SQL v1 sensors and in configuring SQL v2 sensors for the first time.
If you have previously used "SQL v1" sensors, check out section 3.3 Polishing that explains how to define limits. This replaces the previous Post-Processing warning and error conditions setting from the SQL v1 sensors.
Step 1: Creating the SQL query
The first step is to create a script that defines the SQL query "What values do you want to monitor?" The sensors will be able to run almost any SQL query, but you need to code the query yourself. You can create valuable dashboards for non-IT departments of your organization, for example.
Examples:
- How much did my company sell today?
- What is the average order price?
- How many customers' logins are active, how many customers are logged in, exist?
The possibilities are infinite, as long as you are able to create an SQL query for it. At this point, you should not worry about the sensor or PRTG. Use the management console, workbench, or an equivalent management tool of your SQL server and only focus on the SQL query. Keep in mind that for best results the following restrictions apply:
- PRTG can only process numerical values.
- The query should not take several minutes to run. This may cause instability and overload on both PRTG and the SQL server, depending on the scanning interval.
- The number of channels or values returned by the sensor should not be more than 10 and the amount of results should be static (that is, always the same number of columns in the result).
- The sensor is not capable of displaying more than one single string. You may concatenate text from multiple rows in a single string using SQL commands in the query.
For this example, we will work with this simple SQL query:
SELECT count(idorder), sum(value), avg(value), GROUP_CONCAT(customer SEPARATOR ', ')
from test.order
Step 2: Storing the script
If you have created your script with the SQL query and it runs and works in the SQL editor, it is time to store it to disk so that PRTG can use it. The script (with .sql extension) must be stored on your PRTG server under the following path:
| %programfiles(x86)%\PRTG Network Monitor\Custom Sensors\sql\%yoursqlflavor%\ |
In this example, we work with MySQL, so our script has to be stored in the mysql folder. We name it Custom Example.sql. Here is the full path for reference:
| C:\Program Files (x86)\PRTG Network Monitor\Custom Sensors\sql\mysql |
Note: It was previously possible with SQL v1 sensors to directly write the query in the sensor's settings. For security reasons (because it would allow someone to directly modify the query from within the web interface), we now require that the script is stored to disk on the PRTG probe system. This requires access to the operating system of the server running a PRTG probe and improves security. For details, see Why do I have to store SQL sensor queries and custom scripts in files on the probe computer?
The screenshot below illustrates how the result (Step 1+2) will look in your SQL editor. Store the very same query in a text file with .sql extension and copy it to the appropriate folder.
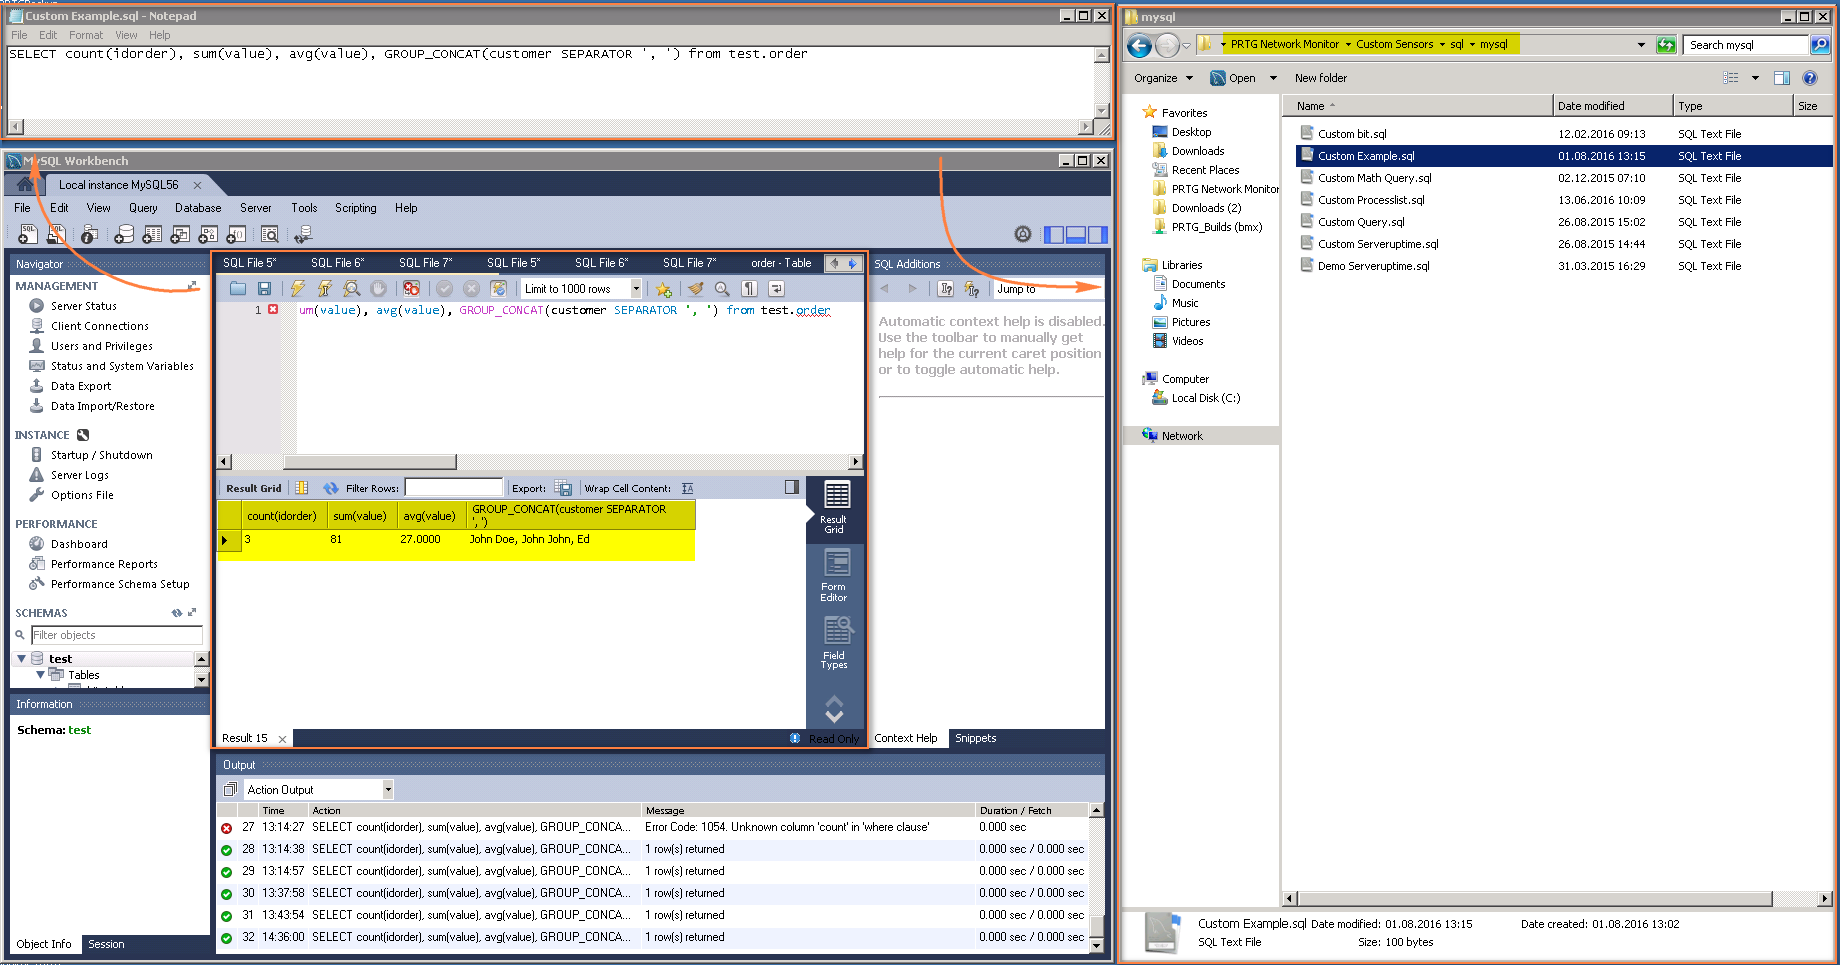
Click to enlarge.
Step 3: Creating the sensor in PRTG
Before proceeding, we strongly recommend that you check that the probe system and your environment meet the sensor's requirements. See the sensor's remarks section in the PRTG Manual.
3.1 Defining the credentials for database sensors
With the SQL v2 sensors, we require that credentials are defined at root, probe, group, or device level. This means that you only have to define the credentials once if you have multiple SQL servers to query with the same credentials. Open the Settings tab of the corresponding object and enter the appropriate SQL credentials in section Credentials for Database Management Systems.
3.2 Creating the sensor
- Right-click the device where you want to deploy the sensors, click Add Sensor from the context menu, search for SQL, and select the appropriate sensor version that you require.
- In the Add Sensor (Step 2 of 2) dialog, enter the Sensor Name and the name of the Database that the sensor will query. In our example the database name is test and we keep the default sensor's name.
- Under the Data section, select the SQL Query File that you saved in Step 1 and define the Transaction approach and if you want PRTG to read or evaluate the results of the query.
- Set the Data Processing option to Process data table. For this example, we work with Process data table. After selecting this option, a whole new section will appear.
- Now it is time to decide on the channel selection approach. The standard option is the default Column number approach, which means that the multiple results from the query will be assigned to incremental numbers, 0, 1, 2, 3 and so on. Our example script returns 4 rows, so we use Column number for the Select Channel Value by option.
- As previously tested and defined, the example script returns the following information from the "order" table.
- The count of unique orders
- The sum of the value of all orders
- The average value of all orders
- A string that contains the customer names (This is interesting if you want to identify results in a TOP kind query.)
To assign the results to channels, enable the desired number of channels. Only one channel is enabled by default. Specify the channel's name (that does not have to match the field's name). Because we chose to select the channel by column number, enter the column number that you want to assign to this channel. The first column has the ID 0 (zero). See the "filled in" settings page in the screenshot below:
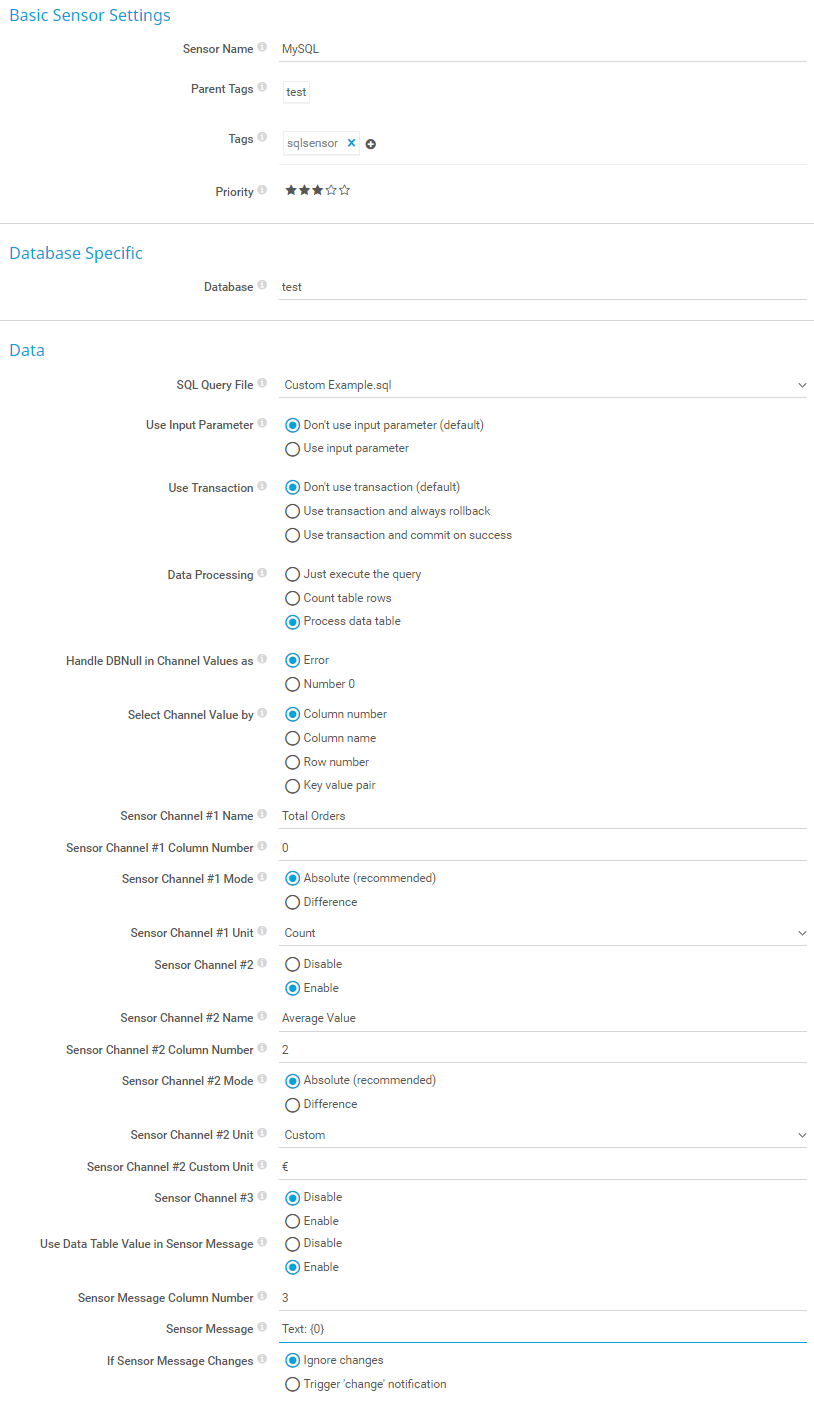
Click to enlarge.
It is not required that you use all results from the query in the sensor and you can also use them in any order.
Note: If you need to map a specific response value to a sensor status (for example, 1 = OK, 2 = Broken, 3 = Success), you need to use lookups. These should be defined during the sensor's creation (and not via the channel settings later). For further details about lookups, see Value interpretation (aka Lookups).
3.3 Polishing (primary channel, limits)
The previous steps are sufficient to get a working sensor. You can take the following steps to "polish" the created sensor.
- Use the pin icon to define your primary channel. The primary channel is somewhat special because its value is displayed in notifications and as a sensor value when browsing the device tree.
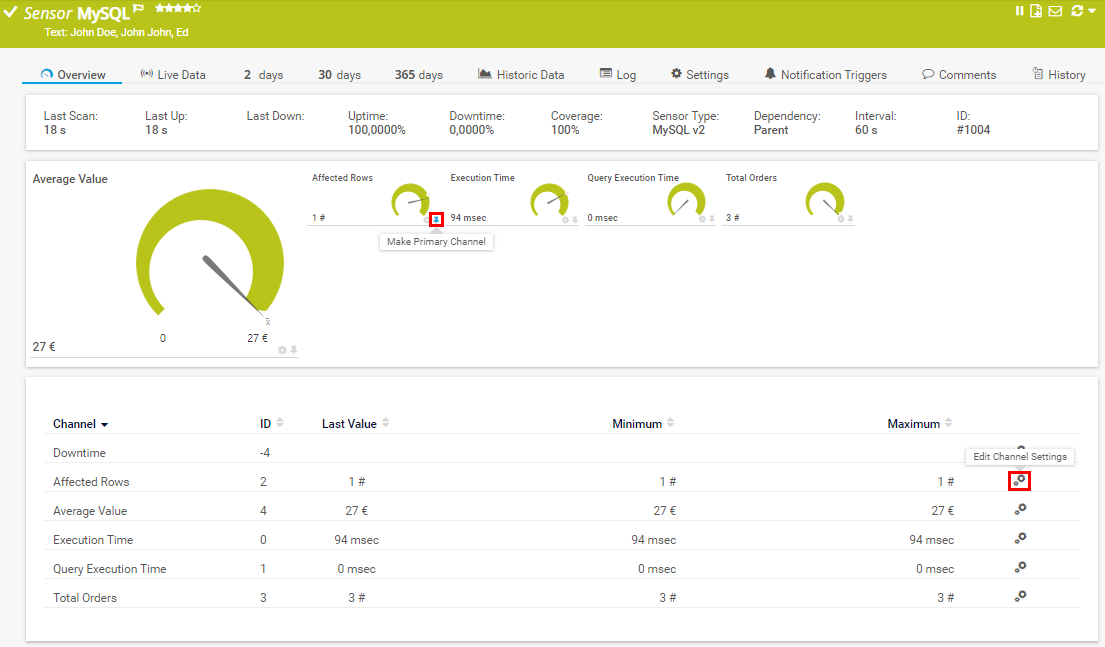
Click to enlarge.
- Click a channel to open its settings and use this window to define limits that are very useful for alerting. With such limits, you can set the sensor to a Warning or a Down status if the value of the channel goes above or below a specific threshold.
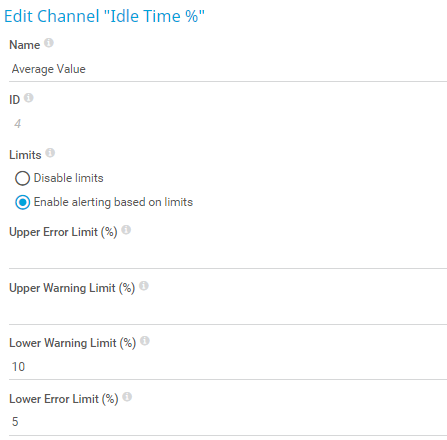
Click to enlarge.
- In the end, your sensor should look like this:
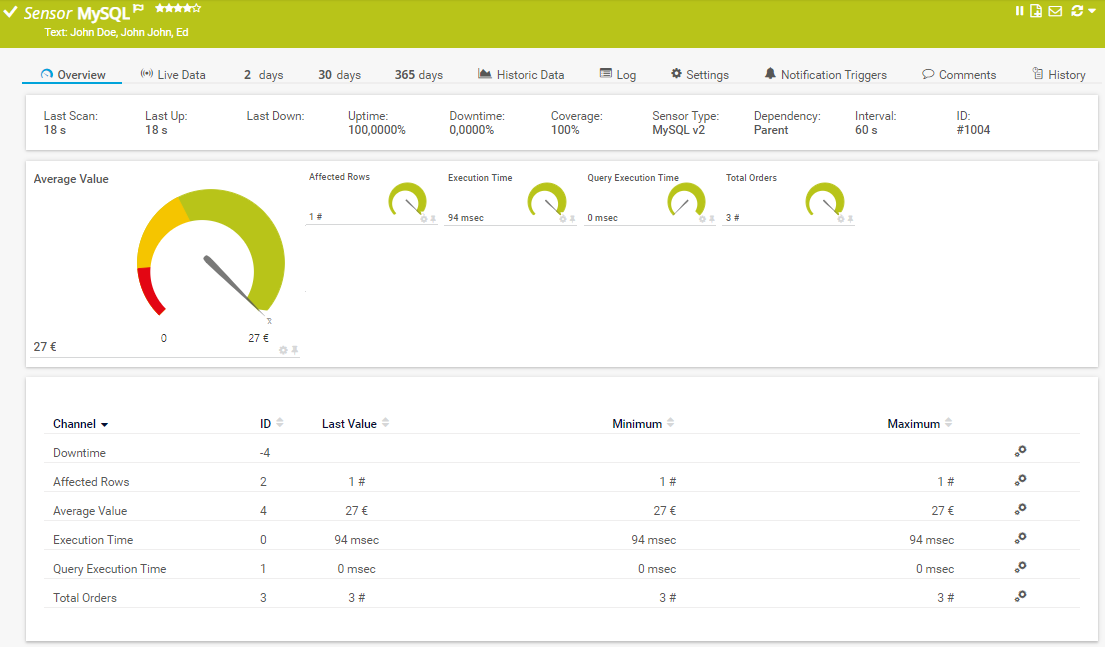
Click to enlarge.
Step 4: Debugging
If you encounter any issues, debugging the sensor is possible via the Write sensor result to disk (Filename: "Result of Sensor [ID].txt") option in the sensor's settings. When this option is set, the following logfiles will be stored to disk on the probe where you created the sensor with every sensor scan and will provide debugging information about the sensor's execution.
| Default path (on the probe system) | %programdata%\Paessler\PRTG Network Monitor\Logs\sensors |
Once you are done with debugging, we recommend that you disable the Write sensor result to disk (Filename: "Result of Sensor [ID].txt") option again because it can affect the sensor's performance.
4.1 Files
| Filename | Content |
|---|
| Result of Sensor [ID].Data.txt | Contains a collection of the sensor's parameters and settings. |
| Result of Sensor [ID].log | Logs the connection to the database, settings, timings, and the received replies. This is useful for debugging. |
| Result of Sensor [ID].txt | Contains the actual output passed to PRTG, usually the very same error message and the values that you see in the PRTG web interface in the sensor message. |
If you encounter issues and the debug files do not tell you anything about the error, you should still keep them if you decide to contact our tech support as they will assist us with troubleshooting.
Related topics
The example below explains the usage of lookups (that have to be defined in the sensor's settings, not in the channel settings) and also demonstrates the usage of a different channel selection value method:
More
| Note: There is a bug in PRTG 16.3.25 that prevents the sensor's message (from the SQL result) from being displayed correctly (it displays "Ok" instead). Update to the latest version if you are experiencing this issue. |


Add comment