This article applies as of PRTG Network Monitor
Accumulating sensor data with HTTP XML/Rest Value sensor
When it comes to huge or several PRTG installations at one company (or as an MSP), it is helpful to display certain indicators of multiple devices or installations within one sensor or on a dashboard. With PRTG, you can gather data of specific sensors either from the same installation or from several ones and show it within one sensor.
The HTTP XML/REST Value sensor is able to retrieve and parse an XML file from a given URL. With the PRTG API, you can create such URLs and use them. You can then add the sensor to a map within the installation you have created it.
How to add and configure an HTTP XML/Rest Value sensor
- Add a new HTTP XML/REST Value sensor to a device in your PRTG installation (for example, to the Probe Device).
- Adjust the Basic Sensor Settings to your needs.
- For example, enter a name to identify the sensor, particularly if you use multiple HTTP XML/Rest Value sensors in your installation.
Further sensor settings and creating the API request
(1) Draft required URL
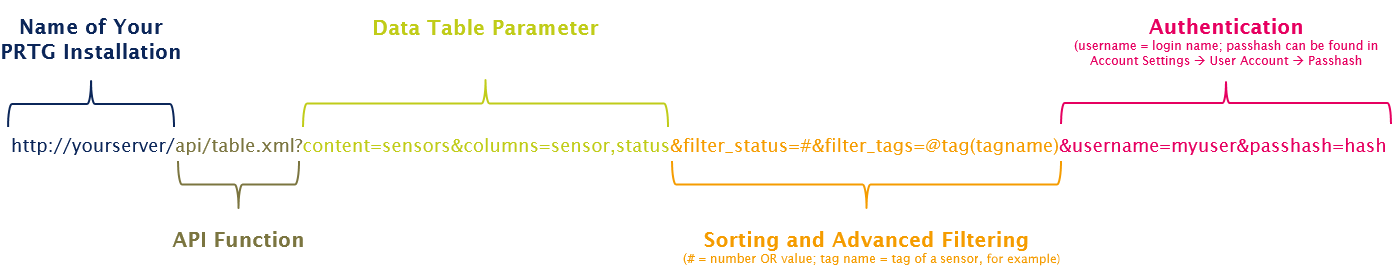
The URL field in the sensor settings is where you have to enter the API request to retrieve the needed data from a PRTG installation.
The following picture shows how you can create the URL for your API request.
Click to enlarge.
The following steps show you how to create such an API request in detail. To prepare the URL, you need a text editor and access to the API of your PRTG installation.
- Provide your PRTG server name: http://<yourPRTGserver>
Access your PRTG installation via the web interface, copy the server name, including http(s)://, and add the name to the text editor.
- Add API function: /api/table.xml
- In the PRTG manual, go to Live Data.
- Add the desired API function (here: table.xml) after the server name in your editor.
- Add data table parameters: ?content=sensors&columns=sensor,status
- You can find all data table parameters here.
- In this use case, the parameters content=sensor and columns=sensor,status are necessary.
- Insert the data table parameters after the API function in your editor.
- Add advanced filter: &filter_status=#&filter_tags=@tag(tagname)
- To get the required information, you need to further filter the data you want to retrieve. For example, filter by name tag to receive data of the desired sensors.
- In this case, you can filter by status (for example, Up OR Down OR Warning) and by tag.
- You can find advanced filters here.
- Example: For all Ping sensors with a Down status, you would use the filter &filter_status=5&filter_tags=@tag(pingsensor)
- Insert your advanced filter after the data table parameters in your editor.
- Add authentication: &username=myuser&passhash=hash
- To access the data of a PRTG installation via the HTTP XML/REST Value sensor, the request needs authentication, that is the credentials of a PRTG user account with sufficient access rights.
- Username: your PRTG login name (for example, PRTG Administrator)
- Passhash: You can find your passhash under Setup | Account Settings | My Account, section User Account. Click Show Passhash to display it.
- Copy the passhash and insert it after passhash= in your editor.
- Insert your authentication after the advanced filter in your editor.
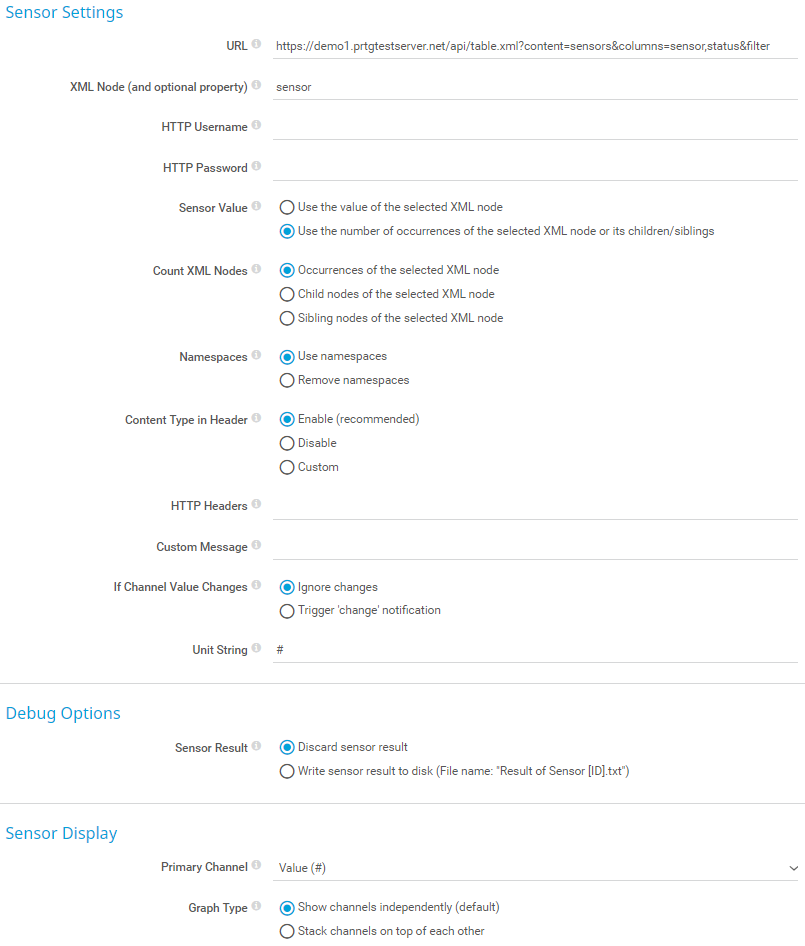
- XML Node and Sensor Value
- Enter the XML Node. This determines the sensor value. In this use case, it is sensor.
- For the Sensor Value setting, select Use the number of occurrences of the selected XML node or its children/siblings to return the sensor count depending on your filter.
(2) Additional settings
Check your sensor settings according to the screenshot below.
Click to enlarge.
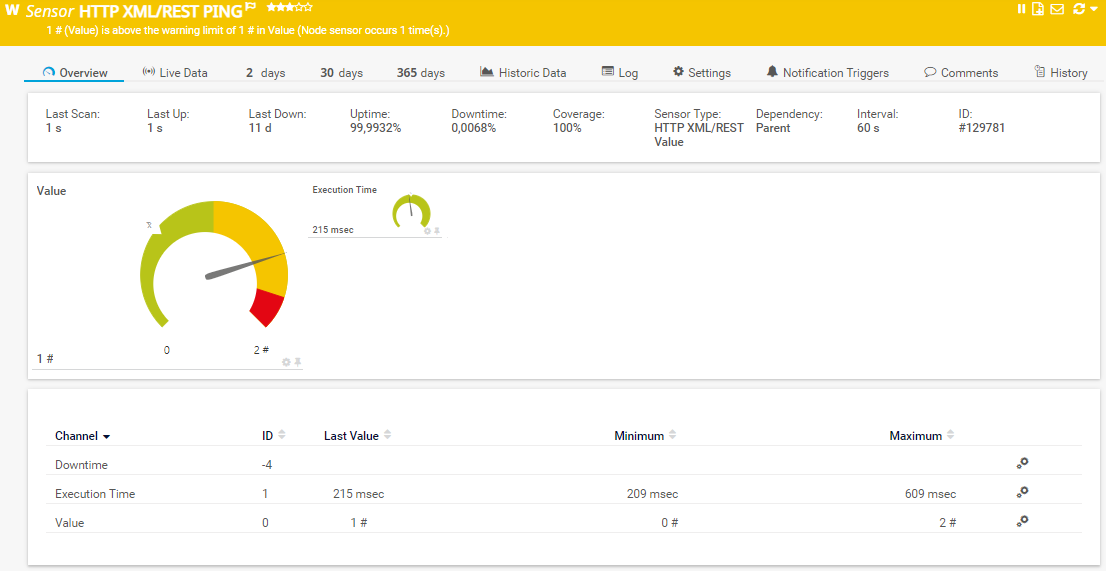
After saving all settings, the sensor will appear in your installation on the device you have added it.
Click to enlarge.
Now you can also add this sensor to a map.
Note: Add limits to the sensor channel settings to receive notifications based on your defined thresholds (for example, if five Ping sensors show a Down status).


Add comment