This article applies to PRTG Network Monitor 16.3.25 or later
Monitoring the Health of Juniper Devices that Run on JunOS
While PRTG does not currently offer any native or built-in sensors for Junos, it should be possible to poll the status of temperature, CPU/memory usage, and other specific metrics of your Juniper device following these instructions. This device template is based on this Juniper KB post and supposedly written for an EX series device, but should also apply to any other Junos device.
We have published a compatible device template that you can use to automate the deployment of these custom sensors using the PRTG auto-discovery.
The sensors will monitor the following properties:
The sensor will monitor Fans, FPCs, PICs, Power Supplies, and other properties and components, from which it can retrieve the following information:
- Buffer Pool Utilization
- CPU Load
- DRAM Size
- Installed Memory
- Overall State
- Temperature
Not all metrics apply to all components, but for technical reasons all components will be checked for these metrics. As defined in Juniper's MIB, the value will be 0 if unavailable or inapplicable. These readings can be ignored or can even be hidden after the sensor's deployment.
Alerts are ONLY provided by the Operating State, which can be:
| Reported Value/Status | PRTG Sensor status |
|---|
| unknown(1),reset(4) | Warning |
| running(2), ready(3), runningAtFullSpeed(5), standby(7) | Ok |
| down(6) | Down/Error |
It is however possible to fine-tune the sensor by defining additional limits in each of the available channels.
Requirements
- PRTG Network Monitor 16.3.25 or later
- Because the device template relies on the auto-discovery process, the device you want to monitor needs to be reachable via ping.
- SNMP must be enabled and the device must support the jnxOperatingTable from the JUNIPER-MIB. According to Juniper, this should be "any device that runs the JunOS".
Known Issues and Limitations
- Due to the way that the underlying SNMP Custom Table sensor works and the way that Juniper makes the data available, all sensors will retrieve all metrics and display the value of 0 when not applicable for the component.
- This device template will mimic the alerts as reported by the monitored device via SNMP (via lookups). If the status is not reported correctly via SNMP, PRTG will not be able to pick up any issues. For additional alerts, please set up limits for additional channels.
- This device template is created based on data collected from other customers, so we cannot guarantee that the sensors described above will work on your systems. You use all components at your own risk.
Deployment and Usage
- Download the required zip archive here.
- Extract the archive to the PRTG program directory. By default, this is %Program Files (x86)%\PRTG Network Monitor\. See the Paessler Knowledge Base to learn more about how and where PRTG stores its data.
- In the PRTG web interface, navigate to Setup | Administrative Tools and click Go! in the Restart Core Server section. This is to ensure that the MIB and lookups are loaded before you run the auto-discovery.
- Create a new device in PRTG with the address (IP or FQDN) of the device that you want to monitor and configure its SNMP credentials accordingly.
- Right-click your new device, select Run Auto Discovery with Template, and select the Custom Juniper JNX Operation from the list.
Note: Using the auto-discovery with a dedicated device template is convenient here because it automates the creation of the dedicated sensors organized in an SNMP Custom Table sensor.
- The sensors should be deployed after a couple of seconds.
- You can adjust the channel limits or lookups to your needs later.
Result
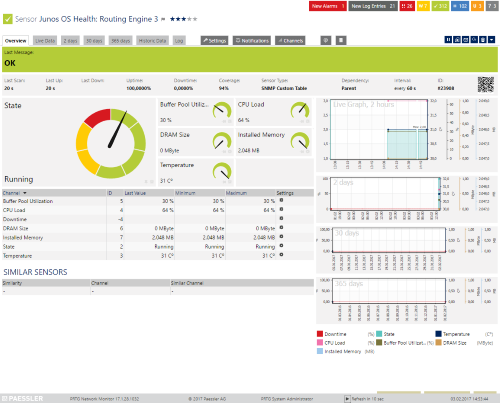
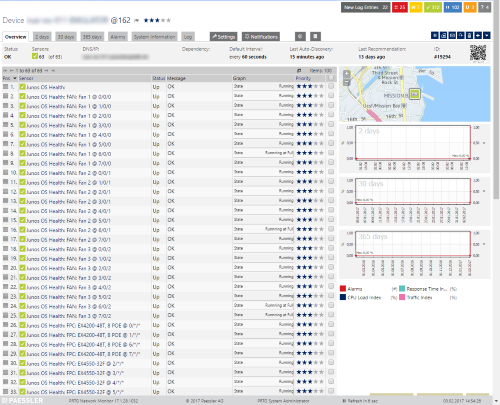
The resulting sensors will look like this:
Sensor's Overview

Click for full-screen view
Device's Overview

Click for full-screen view
No sensors deployed? :(
Please read ahead for troubleshooting.
Troubleshooting
Have any issues? Please don't hesitate to contact us by replying to this post or by contacting us via a support ticket. Please make sure to mention this KB post. Please read ahead for troubleshooting steps that you can perform in advance.
Auto-Discovery
Your Auto-Discovery log can tell you a lot about what went wrong during the sensor's deployment. It's possible to troubleshoot the auto-discovery by inspecting the auto-discovery log. If you get entries like the one below (NOT FOUND), it means that the required protocol or OID isn't available.
[...]
03.02.2017 14:37:06: Device ID: 19294Name: nue-ws-011 EMULATOR@163 Host: somehost.somedomain.sometld
03.02.2017 14:37:06: Device Templates; Device ID: 19294; Selected: 1
03.02.2017 14:37:06: Template Loaded; Device ID: 19294; Name: Custom Juniper JNX Operation
03.02.2017 14:37:07: Template Check; Device ID: 19294; Check ID: ping; FOUND
03.02.2017 14:37:08: Template Check; Device ID: 19294; Check ID: snmp; FOUND
03.02.2017 14:37:09: Template Check; Device ID: 19294; Check ID: jnxOperatingTable; NOT FOUND
[...]
In the example above, the discovery was interrupted because the device didn't respond to the jnxOperatingTable check. This means that your device is probably not compatible with the sensor. You can also use this log to identify if the discovery was interrupted because the device didn't respond to Ping or to a basic SNMP check.
SNMP Data
If the discovery log isn't sufficient, you can review the SNMP data directly from your device. To do so, please refer to the information below. You should have this information at hand when contacting our support team. You can save the text below (in the square) as .txt and use it with the Scan Script option in our SNMP Tester. This will allow you to review which SNMP queries succeed and which ones don't deliver any data.
hrSystemUptime
walk=1.3.6.1.2.1.25.1.1
MIB-2 System
walk=1.3.6.1.2.1.1

jnxOperatingTable
walk=1.3.6.1.4.1.2636.3.1.13
Best Regards,
Luciano Lingnau [Paessler Support]
Further Reading


Add comment