This article applies to PRTG Network Monitor 16.3.25 or later
Advanced Monitoring of APC UPS Systems
While PRTG provides a built-in SNMP APC Hardware sensor and a standard UPS (APC) device template, you may still be interested in even more detailed sensors.
APC has a rather unusual approach and all devices rely on the very same PowerNet-MIB: if you have an APC Smart-UPS, this device template is very likely compatible. The sensor will monitor Inputs, Output, Diagnostic Results, Battery Status, and Temperature Probes.
You can use a device template to automatically create these custom sensors with the PRTG auto-discovery.
The sensors will monitor the following properties:
The actually monitored metrics will vary and depend on size, management, and monitoring capabilities of your UPS. But if the data is available, the sensor will be able to monitor the following:
- Diagnostic
- Schedule
- Result of Last Test
- Environment Readings
- Probe Status
- Temperature
- Humidity
- High Temperature Threshold Reached
- Max Temperature Threshold Reached
- Line Input
- Frequency
- Voltage*
- Last Fail Cause*
- Line Output
- Load
- Power*
- Voltage
- Current*
- Basic Output
- Battery
- Basic Status
- Capacity
- Temperature
- Run-time Remaining
- Replacement Indicator
- Universal IO Probes
- Probe Status
- Temperature Celsius
- Temperature Fahrenheit
- Humidity
- Alarm
The device template will create available and compatible sensors based on the data available. It will avoid creating redundant sensors if more than one data source is available, except for temperature probes: in this case, it will deploy sensors for both Universal IO sensors and for Environmental sensors. The device template will also deploy the Universal IO sensors on devices that are not an UPS, as long as the data is available and valid.
The sensors will implement default alerts whenever possible, but most channels can still be fine-tuned by defining additional limits or modifying the lookups included by default.
Requirements
- PRTG Network Monitor 16.3.25 or later
- Because the device template relies on the auto-discovery process, the device you want to monitor needs to be reachable via ping.
- SNMP must be enabled and the device must support the PowerNet-MIB from APC.
- The device template has been tested with the following devices so far:
- APC Smart-UPS X 750
- APC Smart-UPS VT 10 kVA
- APC Smart-UPS RT 6000 RM XL
Known Issues and Limitations
- Due to the way that the underlying SNMP Custom Table sensor works, there may be cases where the data is available but invalid. This will be clearly visible because the sensor will display measurements like Frequency -0.10% or Humidity -1% or 0%. You can ignore these readings or pause or delete the whole sensor.
- PRTG will show the alerts as reported by the monitored device via SNMP using lookups. If the status is not reported correctly via SNMP, PRTG will not be able to pick up any issues. For additional alerts, please set up limits for additional channels.
- This device template is created based on data collected from other customers, so we cannot guarantee that the sensors described above will work on your systems. Use all components at your own risk. Please test and validate the sensors in your environment after deploying them.
Deployment and Usage
- Download the required zip archive here.
- Extract the archive to the PRTG program directory. By default, this is %Program Files (x86)%\PRTG Network Monitor\. See the Paessler Knowledge Base to learn more about how and where PRTG stores its data.
- In the PRTG web interface, navigate to Setup | Administrative Tools, and click Go! in the Restart Core Server section. This ensures the MIB and lookups are loaded before you run the auto-discovery.
- Create a new device in PRTG with the address (IP or FQDN) of the device that you want to monitor and configure the SNMP credentials accordingly.
- Right-click your new device, select Run Auto Discovery with Template, and select the Custom APC UPS v0.8 from the list.
Note: Using the auto-discovery with a dedicated device template is convenient here because it automates the creation of the custom sensors in an organized fashion.
- The sensors will be deployed after a couple of seconds.
- You can adjust the channel limits or lookups to your needs later.
Result
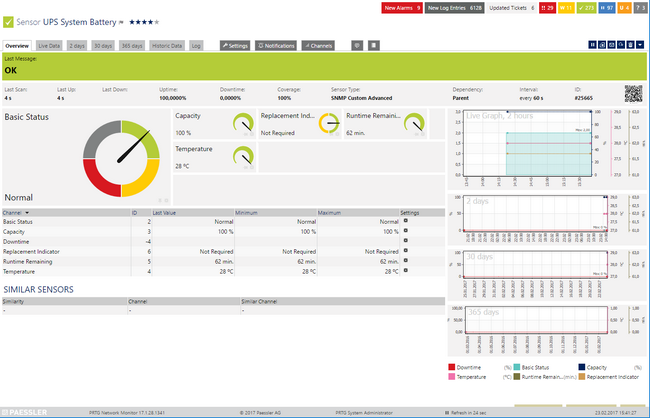
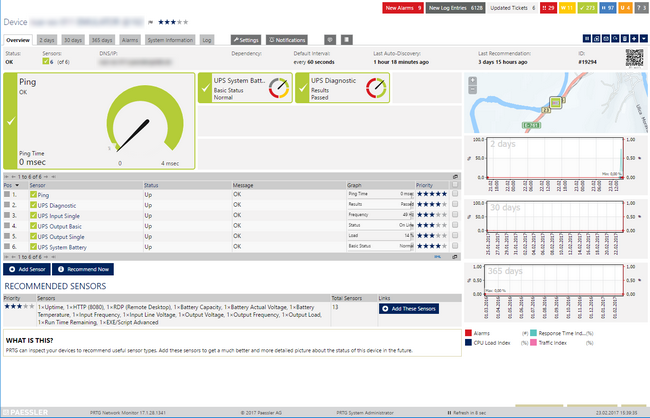
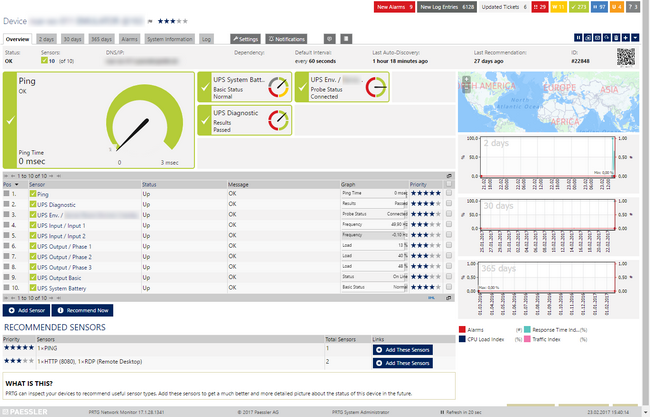
The resulting sensors will look like this:
Sensor Overview
Click for full-screen view
Device Overview
Small UPS
Click for full-screen view
Larger UPS
Click for full-screen view
No sensors deployed? :(
Please read ahead for troubleshooting.
Troubleshooting
Have any issues? Please don't hesitate to contact us by replying to this post or by contacting us via a support ticket. Please make sure to mention this KB post. Please read ahead for troubleshooting steps that you can perform in advance.
Auto-Discovery Log
Your Auto-Discovery log can tell you a lot about what went wrong during the sensor's deployment. You can troubleshoot the auto-discovery by inspecting the auto-discovery log. If you get entries like the one below (NOT FOUND), it means that the required protocol or OID is not available.
[...]
23.02.2017 14:37:58: Device ID: 19294 Name: somename EMULATOR@163 Host: somehost.somedomain.sometld
23.02.2017 14:37:58: Device Templates; Device ID: 21890; Selected: 1
23.02.2017 14:37:58: Template Loaded; Device ID: 21890; Name: Custom APC UPS v0.8
23.02.2017 14:38:01: Template Check; Device ID: 21890; Check ID: ping; FOUND
23.02.2017 14:38:01: Template Assigned; Device ID: 21890; Name: Custom APC UPS v0.8
23.02.2017 14:38:06: Template Check; Device ID: 21890; Check ID: snmp; FOUND
23.02.2017 14:38:11: Template Check; Device ID: 21890; Check ID: snmp_upsAdvTest; FOUND
23.02.2017 14:38:16: Template Check; Device ID: 21890; Check ID: snmp_upsPhaseInputTable; NOT FOUND
23.02.2017 14:38:21: Template Check; Device ID: 21890; Check ID: snmp_upsPhaseOutputPhaseTable; NOT FOUND
23.02.2017 14:38:26: Template Check; Device ID: 21890; Check ID: snmp_upsBasicOutputStatus; FOUND
23.02.2017 14:38:31: Template Check; Device ID: 21890; Check ID: snmp_upsBasicSystemStatus; ERROR: 106
23.02.2017 14:38:36: Template Check; Device ID: 21890; Check ID: snmp_upsBattery_various; FOUND
23.02.2017 14:38:41: Template Check; Device ID: 21890; Check ID: snmp_iemStatusProbesTable; FOUND
23.02.2017 14:38:46: Template Create Meta Request; Device ID: 21890; Create ID: envProbesTable; FOUND: 1
23.02.2017 14:38:51: Template Check; Device ID: 21890; Check ID: snmp_upsAdvInput; FOUND
[...]
In the example above, some sensors were skipped because the device did not respond to the snmp_upsPhaseInputTable check. This means that this data is probably not available on your device. You can track this data by looking for the name after snmp_. In this case, a search for upsPhaseInputTable will tell you which OID from the MIB is missing.
You can also use this log to identify if the discovery was interrupted because the device did not respond to Ping or to a basic SNMP check.
SNMP Data
If the discovery log is not sufficient, you can review the SNMP data directly from your device. To do so, please refer to the information below. Please have this information at hand when contacting our support team. You can save the text below (in the square) as .txt and use it with the Scan Script option in our SNMP Tester. This will allow you to review which SNMP queries succeed and which ones did not deliver any data.
--------
Walk Default
--------
hrSystemUptime
walk=1.3.6.1.2.1.25.1.1
--------
MIB-2 System
walk=1.3.6.1.2.1.1
--------
Sensor Specific Queries
----
upsTest
walk=1.3.6.1.4.1.318.1.1.1.7
----
upsPhase
walk=1.3.6.1.4.1.318.1.1.1.9
----
upsBasicOutputStatus
walk=1.3.6.1.4.1.318.1.1.1.4.1
----
upsBattery
walk=1.3.6.1.4.1.318.1.1.1.2
----
iemStatus
walk=1.3.6.1.4.1.318.1.1.10.2.3
----
upsAdvInput
walk=1.3.6.1.4.1.318.1.1.1.3.2
----
upsHighPrecOutput
walk=1.3.6.1.4.1.318.1.1.1.4.3
----
universalInputOutput
walk=1.3.6.1.4.1.318.1.1.25
----
Best Regards,
Luciano Lingnau [Paessler Support]


Add comment