This article applies as of PRTG 23
Sensors for FortiGate firewalls
While PRTG provides a couple of sensors that work with FortiGate firewalls by default, for example the FortiGate System Statistics sensor, the SNMP Traffic sensor, and the SNMP System Uptime sensor, you may still be interested in more detailed sensors.
FortiGate has a very extensive SNMP implementation that can lead to issues when you try to import or deploy a complete .oidlib file and use the SNMP Library sensor. If you encounter this issue, see MIB problems: PRTG hangs when adding SNMP library sensor.
In this article, we describe a different approach that does not use the .oidlib file, but you could still use it for other sensors.
Adding FortiGate sensors via auto-discovery
You can use the device template that we provide below to automatically create custom sensors with the auto-discovery.
The metrics that you can actually monitor vary depending on the size, management, and monitoring capabilities of your firewall model. The sensors can monitor the following if the data is available:
- System Statistics
- Total CPU Usage
- Session Count
- Memory Usage
- Detailed CPU Metrics
- Total Usage (per CPU)
- User (time) Usage
- System (time) Usage
- Hardware Sensor
- HA Member (One Sensor per Member)
- CPU Usage
- Memory Usage
- Session Count
- Sync Status
- VPN Tunnel
- Status (state)
- Traffic In/Out
- VPN Tunnel(Dial-Up)
- Link Monitor
- State (Alive/Dead)
- Packets Sent/Received
- Latency
- Jitter
- FortiAP™
- State
- Uptime (ms)
- Connected Clients
- Traffic In
- Traffic Out
- CPU Usage
- Memory Usage
The device template creates the available and compatible sensors based on the data at hand. The sensors implement default alerts whenever possible, but you can still fine-tune most channels by defining additional limits in the channel settings or modifying the lookups included by default.
Requirements
- PRTG 16.3.25 or later
- Because the device template relies on the auto-discovery process, the device you want to monitor needs to be reachable via ping.
- SNMP must be enabled and the device must support the FORTINET-FORTIGATE-MIB from FortiGate.
Known issues and limitations
- Because of the way that the vendor implemented the MIB, the Health sensors do not provide a unit for the readings, but provide alerts since the sensors also evaluate the status of the fgHwSensorEntAlarmStatus for the corresponding entry.
- A non-clustered unit may cause alerts (Warning by lookup value 'Unsynchronized' in Sync Status) - You can either adjust the lookup or delete this sensor if you're not using a cluster.
- A non-installed, redundant power supply may be recognized as an issue or alarm. If your device does not have an RPS, you can either acknowledge or delete the sensor to stop this alert.
- PRTG shows the alerts as reported by the monitored device via SNMP using lookups. If the status is not reported correctly via SNMP, PRTG cannot detect any issues. For additional alerts, please set up limits for additional channels.
- This device template was created based on data collected from other customers, so we cannot guarantee that the sensors described above will work on your systems. Use these components at your own risk. Please test and validate the sensors in your environment after deploying them.
- VPN Tunnel: The template will produce one VPN Tunnel sensor per VPN x SA (Security Association). As a result you may see two or more entries for a single VPN. This happens because each VPN is listed as multiple entries in the fgVpnTunTable, distinguishable only by the fgVpnTunEntPhase2Name. To get an "Overall" status when there are multiple entries per VPN, consider the Business Process sensor. Here are a couple of examples: How can I use the Business Process sensor?
- VPN Tunnel: We have observed cases where when monitoring an IPsec tunnel, issues in the Phase 2 would not be reported at SNMP level and couldn't be picked up by the sensor. When monitoring a particularly important VPN, we strongly encourage you to, in addition to this template/sensor, also create reachability sensors (ping, HTTP, port, ...) for devices on the remote side of the VPN, to make sure you don't miss out on a Phase 2 issue on an IPsec VPN.
- VPN Tunnel(Dial-Up): It's not possible to monitor its status, only the bandwidth (it's a MIB limitation). If bandwidth is always supposed to be present, one can configure very low lower warning/error limits to get alerted when there's no more traffic on the link, although this can easily lead to false positives. This sensor will stop working if the Remote gateway IP address of the tunnel changes. In this case, either deploy the sensor anew or change the IP address in the sensor's settings (Identifier) manually.
Deployment and usage
- Download the required zip archive here.
- Extract the archive to your PRTG program directory. By default, this is %Program Files (x86)%\PRTG Network Monitor\.
- In PRTG, restart the core server: open Setup | System Administration | Administrative Tools | Restart PRTG Core Server Service and click Go!. This ensures that the MIB and lookups are loaded before you run the auto-discovery.
- Create a new device in PRTG with the address (IP address or FQDN) of the device that you want to monitor and configure the SNMP credentials accordingly.
- Right-click your new device, select Auto-Discovery | Run Auto-Discovery with Template, and select the Custom Fortigate Health v0.x from the list.
Note: Using the auto-discovery with a dedicated device template is convenient here because it automates the creation of the custom sensors in an organized fashion.
- The sensors are deployed after a couple of seconds.
- You can adjust the channel limits or lookups to your needs later.
Result
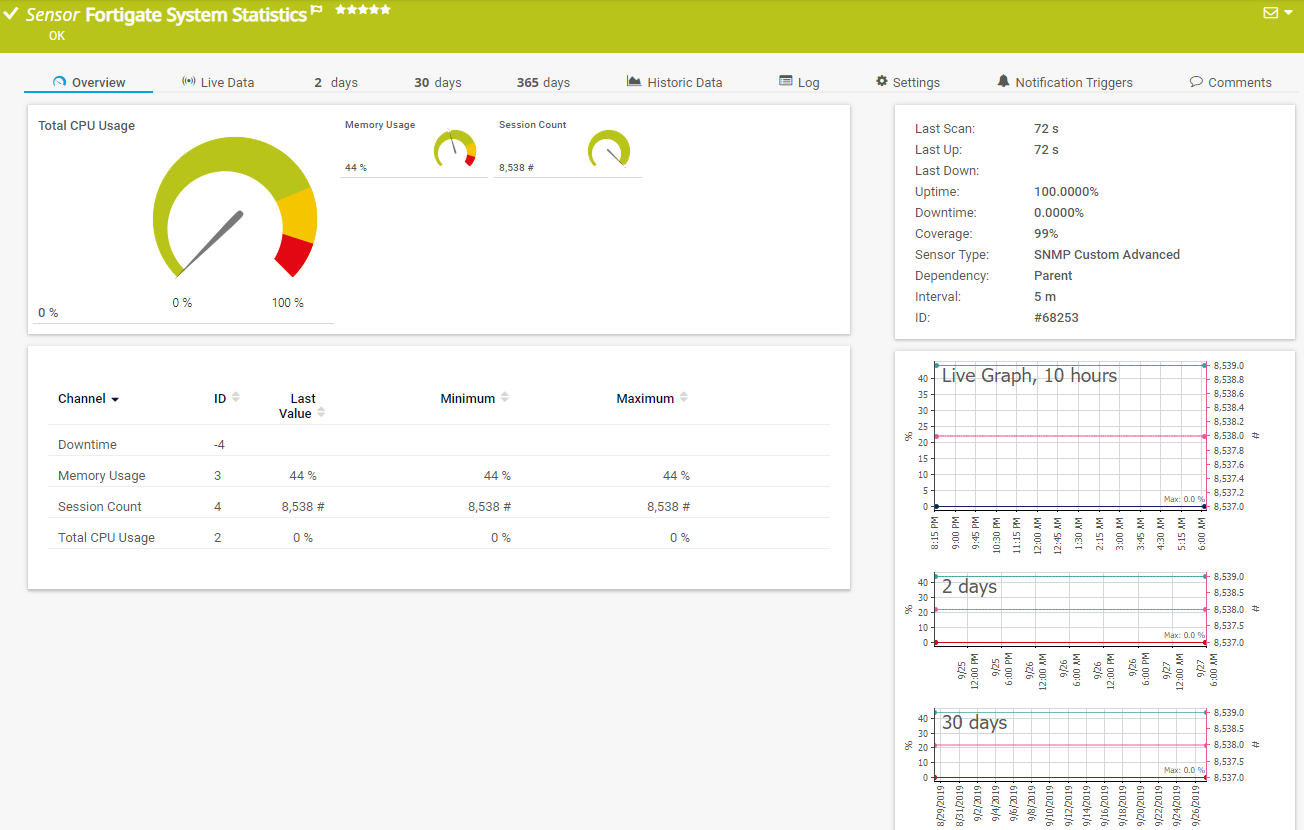
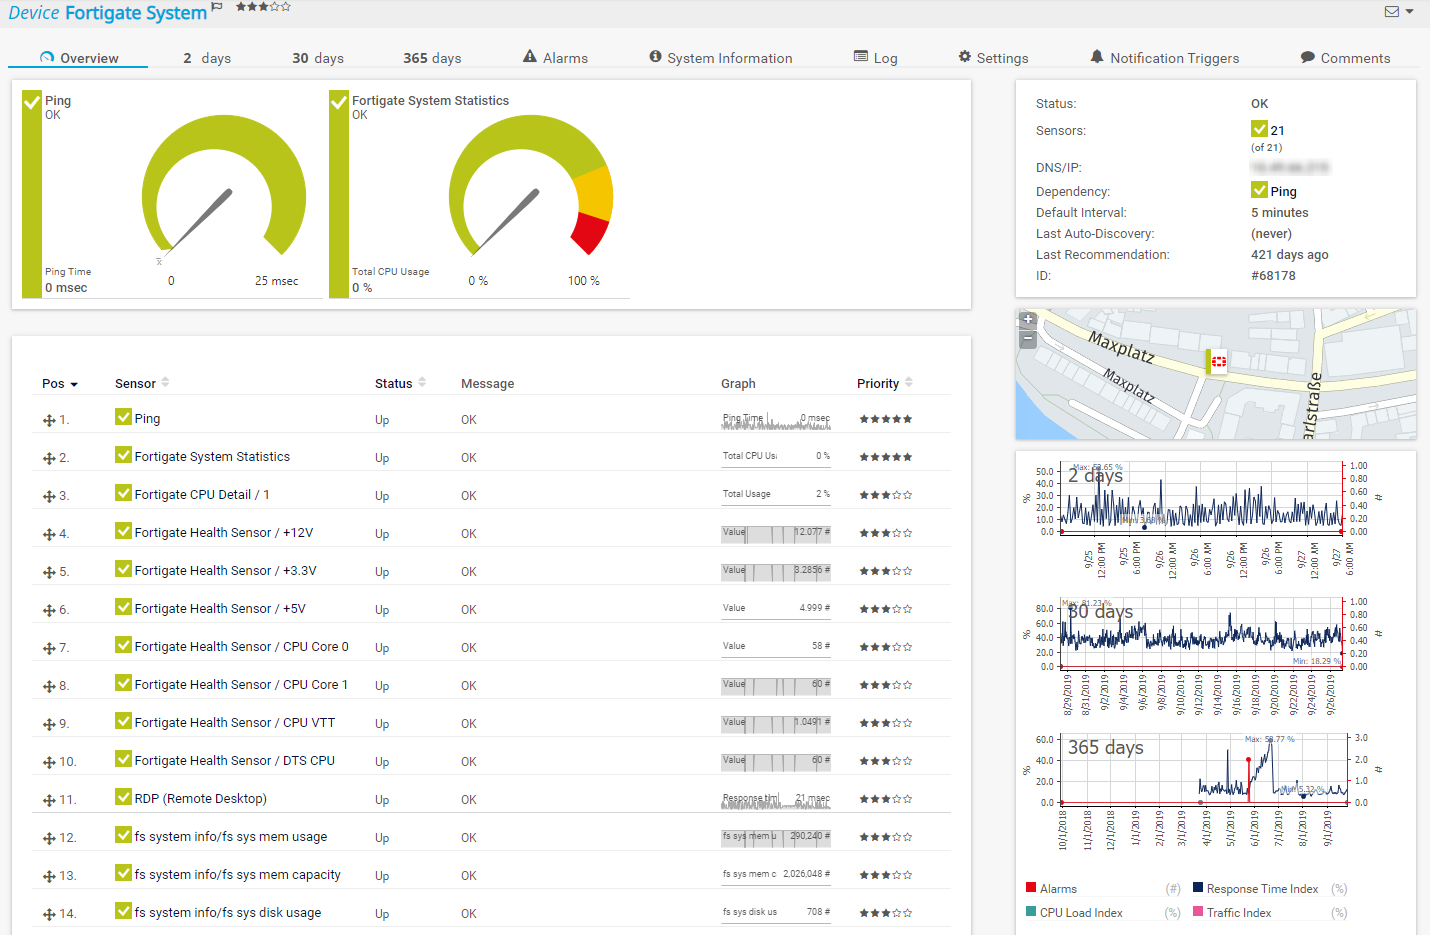
The resulting sensors look like this:
Sensor overview

Click to enlarge.
Device Overview

Click to enlarge.
No sensors deployed? :(
Please read ahead for troubleshooting.
Troubleshooting
Have any issues? Please don't hesitate to contact us by replying to this post or via a support ticket. Please make sure to mention this KB post. Please read ahead for troubleshooting steps that you can take in advance.
Auto-discovery log
Your auto-discovery log tells you a lot about what went wrong during the sensor's deployment. You can troubleshoot the auto-discovery by inspecting the auto-discovery log. If you get entries like the one below (NOT FOUND), it means that the required protocol or Object Identifier (OID) is not available.
[...]
23.02.2017 14:37:58: Device ID: 19294 Name: somename EMULATOR@163 Host: somehost.somedomain.sometld
23.02.2017 14:37:58: Device Templates; Device ID: 21890; Selected: 1
23.02.2017 14:37:58: Template Loaded; Device ID: 21890; Name: Custom Fortigate Health v0.1
23.02.2017 14:38:01: Template Check; Device ID: 21890; Check ID: ping; FOUND
23.02.2017 14:38:01: Template Assigned; Device ID: 21890; Name: Custom Fortigate Health v0.1
23.02.2017 14:38:06: Template Check; Device ID: 21890; Check ID: snmp_fgProcessorTable; FOUND
23.02.2017 14:38:16: Template Check; Device ID: 21890; Check ID: snmp_fgHwSensorTable; NOT FOUND
[...]
In the example above, some sensors were skipped because the device did not respond to the snmp_fgHwSensorTable check. This means that this data is probably not available on your device. You can track this data by looking for the name after snmp_. In this case, a search for fgHwSensorTable will tell you which OID from the MIB is missing.
You can also use this log to identify if the discovery was interrupted because the device did not respond to ping or to a basic SNMP check.
SNMP data
If the discovery log is not sufficient, you can review the SNMP data directly from your device. To do so, save the text below (in the white box) as .txt and use it with the Scan Script option in our SNMP Tester. This will allow you to review which SNMP queries succeed and which do not deliver any data. Please have this information at hand when contacting our support team.
--------
Fortinet Fortigate Device Template (https://kb.paessler.com/en/topic/73911)
Version: 0.8
--------
hrSystemUptime
walk=1.3.6.1.2.1.25.1.1
--------
MIB-2 System
walk=1.3.6.1.2.1.1
--------
Sensor Specific Queries
----
fgha
walk=1.3.6.1.4.1.12356.101.13.1
----
fgSystem
walk=1.3.6.1.4.1.12356.101.4
----
fgAppWebCache
walk=1.3.6.1.4.1.12356.101.10.113
----
fgVpnTunTable
walk=1.3.6.1.4.1.12356.101.12
----
fgLinkMonitor
walk=1.3.6.1.4.1.12356.101.4.8
----
fgWcWtpSessionTable
walk=1.3.6.1.4.1.12356.101.14.4.4
----
Version History
| Version | Description |
|---|
| 0.1 | Initial Release |
| 0.2 | Added HA Member sensor(s) |
| 0.3 | Fixed issue in HA Status Lookup (thanks JohnG) |
| 0.4 | Added VPN Tunnel Status/Traffic (thanks Mark G.) |
| 0.5 | Added support for Fortigate Link Monitors |
| 0.6 | Modified the way the "VPN Tunnel" works to make them more reliable (in Detail: The sensor now uses the fgVpnTunEntPhase2Name for tracking within the Table. This means one working sensor per VPNxSA |
| 0.8 | Added support for monitoring several metrics of FortiAP units connected to the Fortigate. As well as support for Dial-Up VPNs. |
Best Regards,
Luciano Lingnau [Paessler Support]


Add comment