I would like to get historic data from the PRTG API. How do I do this and what kind of information can I get?
1 Reply
Votes:
0
This article applies as of PRTG 22
Getting historic sensor data from the PRTG API
The PRTG API allows you to pull historic sensor data from the web interface in XML, CSV, or JSON format using the Historic Data tab. You can request the results of each single monitoring request (called raw data), or you can let PRTG calculate averages of the data (for example, hourly or daily averages).
The API documentation contains all the information that you need to build your queries. You can run API calls from a supported browser in URL format. The URL call must include the PRTG website name, for example:
https://<your-PRTG-server>/api/historicdata.xml....
Limitations
There are some limitations to prevent potential server overload when you query historic sensor data via the PRTG API:
- Maximum 40 days of data for raw data requests.
- Maximum 500 days of data per API request for averages. If you try using a larger time span than 500 days, PRTG will automatically reduce it to 365 days.
- Maximum 5 API calls per minute.
API calls for historic data
There are three API calls for historic data tables. The first URL will give you the data in XML format, the second URL will respond with CSV data, and the third URL will return JSON.
Note: You must supply the object ID of a sensor as well as a start date/time sdate and end date/time edate. For security reasons, you must now also include your username and password to view the data.
XML format
/api/historicdata.xml?id=objectid&avg=0&sdate=2022-01-20-00-00-00&edate=2022-01-21-00-00-00&username=username&password=password
CSV format
/api/historicdata.csv?id=objectid&avg=0&sdate=2022-01-20-00-00-00&edate=2022-01-21-00-00-00&username=username&password=password
JSON format
/api/historicdata.json?id=objectid&avg=0&sdate=2022-01-20-00-00-00&edate=2022-01-21-00-00-00&usecaption=1&username=username&password=password
Note: If you use the JSON call, additionally providing the parameter usecaption=1 will give you more information than just the raw data table. However, doing so will also result in a report of only raw values.
Refer to the following table regarding the units of the raw data returned by a historic sensor API call:
| Caption | Unit |
|---|---|
| Health | percent |
| Free Virtual Memory | bytes |
| Free Page File Memory | bytes |
| Free Physical Memory | bytes |
| Committed Memory | bytes |
| CPU Load | percent |
| Handles | number |
| Threads | number |
| Raw Data Buffer | number |
| Maintenance Days | number |
| Age of Code | seconds |
| Configuration Last Saved | seconds |
| Probe Messages per Second | messages per second |
| Notifications in Send Queue | number |
| Number of State Objects | number |
| Coverage | percent |
Example
You can use the following example call to query historic data for a Core Health sensor with ID #1002 in CSV format:
/api/historicdata.csv?id=1002&avg=0&sdate=2017-10-20-00-00-00&edate=2017-11-20-00-00-00
The avg (average) is 0 so raw data is displayed. The sdate is October 20th, 2017 at 12 A.M. and the edate is November 20th, 2017 at 12 A.M. The result is a spreadsheet (CSV) file where each sensor channel is a column.
API call for historic graphs
You can also use an API call to display your historic sensor data in a graph in PNG format:
/chart.png?id=objectid&sdate=2022-08-16-14-13-00&edate=2022-08-20-14-13-00&height=300&width=1000&graphstyling=baseFontSize='12'%20showLegend='1'&graphid=-1
Using the example from above, the graph will look something like this:
Common parameters for historic data API calls
You can use the following parameters for the historic graphs and data tables:
| Parameter | Description | Possible values |
|---|---|---|
| objectid | ID of the specific sensor | integer value |
| sdate | Start of the time span (date and time) | yyyy-mm-dd-hh-mm-ss |
| edate | End of the time span (date and time) | yyyy-mm-dd-hh-mm-ss |
| avg | Average interval in seconds; use 0 to download raw data (= results of all single monitoring requests) | integer value |
| width/height | Width and height of the graph in pixels | integer value |
| graphstyling | baseFontSize='x' sets the size of the font, showLegend='x' enables (1) or disables (0) the graph legend | baseFontSize='x'%20showLegend='x' |
Running reports from the web interface
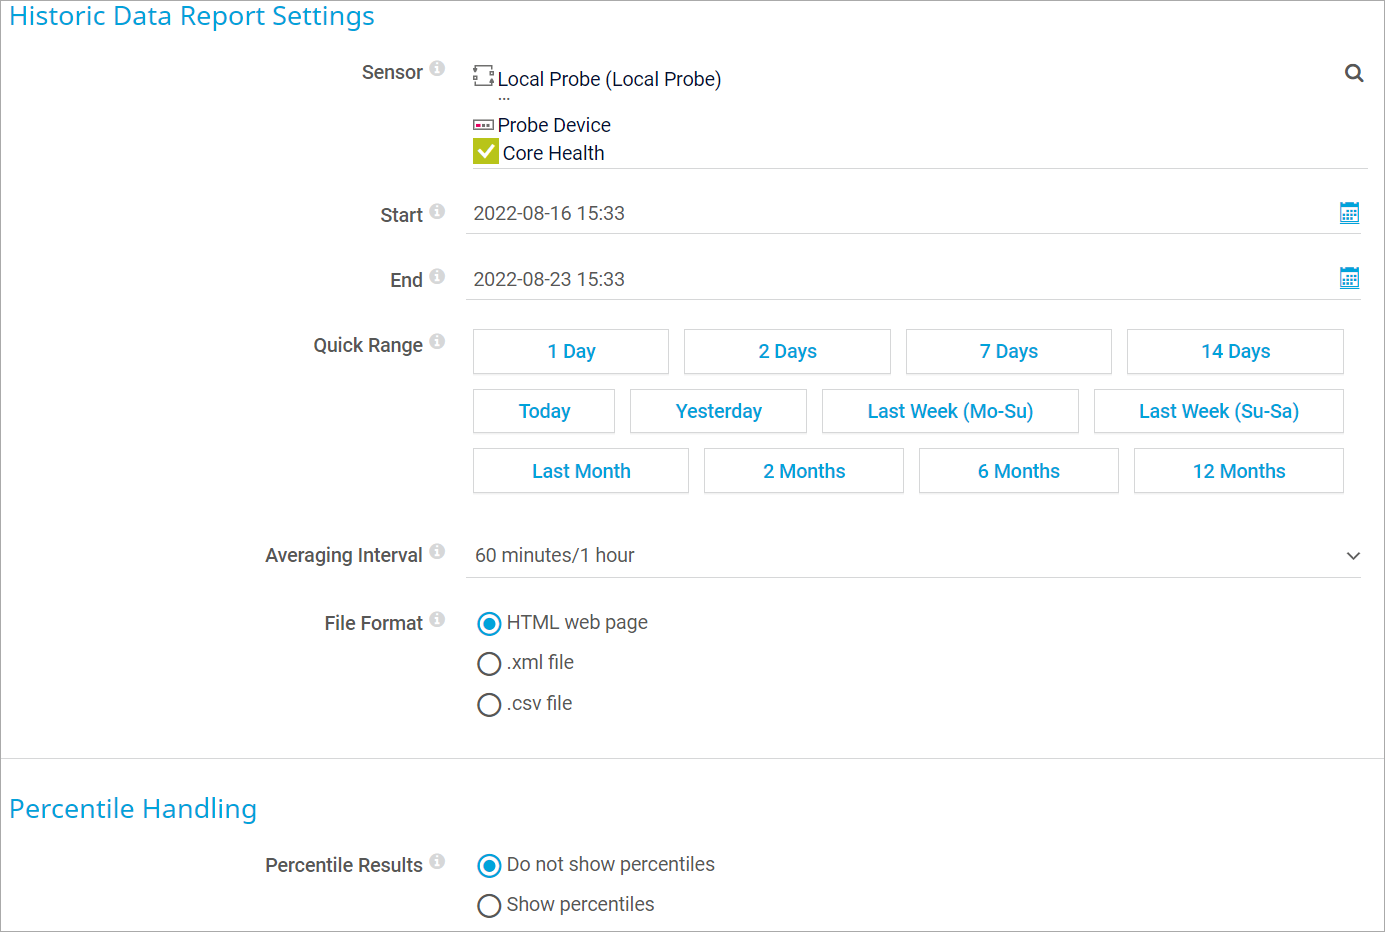
You can query historic sensor data directly within the PRTG web interface from the main menu under Sensors | View Historic Data or via the Historic Data tab on a sensor's detail page.
- Choose the sensor you want to create a report for using the object selector, for example the Core Health sensor.
- Enter the start/end date and time of the data you want to review or use the quick range options.
- Select an average interval. The No Interval (Display Raw Data) option displays raw data only.
- Select an output format for the report data, for example HTML web page. This is a good option to check results before exporting to another file format.
- Optionally include percentile calculations.
- Click the Start button to retrieve the historic data report.
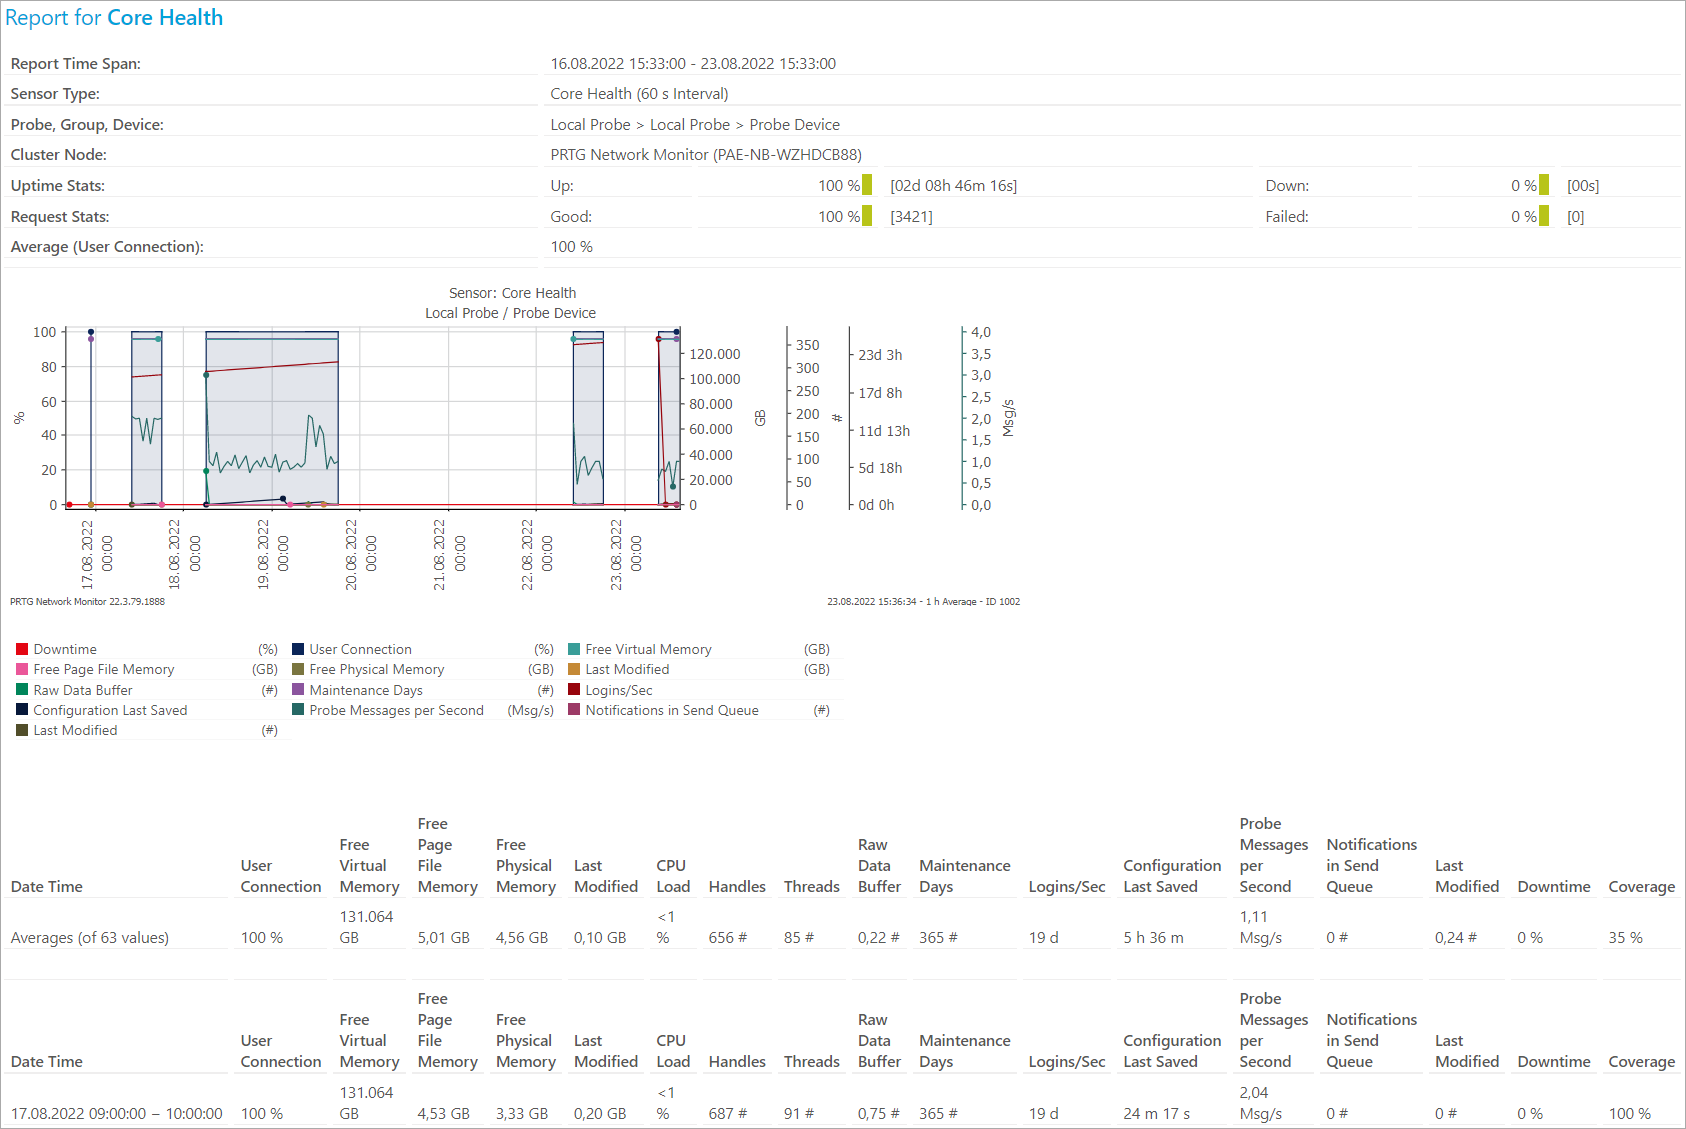
The HTML web page will look like this

Click to enlarge.
Historic Data Query Builder
The query builder tool allows you to experiment with API calls. The tool automatically builds and tests your desired queries. You can find the tool under Setup | PRTG API | Live Data, section PRTG HTTP API: XML Table Query Builder.
Detailed HTTP API documentation
For information about the HTTP API, see PRTG Manual: HTTP API.
More
Created on Nov 20, 2017 10:27:44 AM by
Brandy Greger [Paessler Support]
Last change on Jan 4, 2023 2:57:01 PM by
Brandy Greger [Paessler Support]


Add comment