This article applies to PRTG Network Monitor 17.4.35 or later
Monitoring KEMP LoadMasters
PRTG provides some sensor types that work with Kemp LoadMasters by default, for example, the SNMP Traffic sensor and the SNMP System Uptime sensor. If you need KEMP sensors with more detailed and specific metrics, follow the instructions in this article.
Adding Custom Sensors Using Auto-Discovery and Template
You can use the device template that we provide below to automatically create custom sensors with the PRTG auto-discovery.
The metrics that are available can vary. The sensors can monitor the following if the data is available:
- Health (KEMP status and performance)
- Available Memory
- Total Memory
- CPU Usage
- HA State
- Current SSL TPS
- Total Current TPS
- Num Services
- UpTime
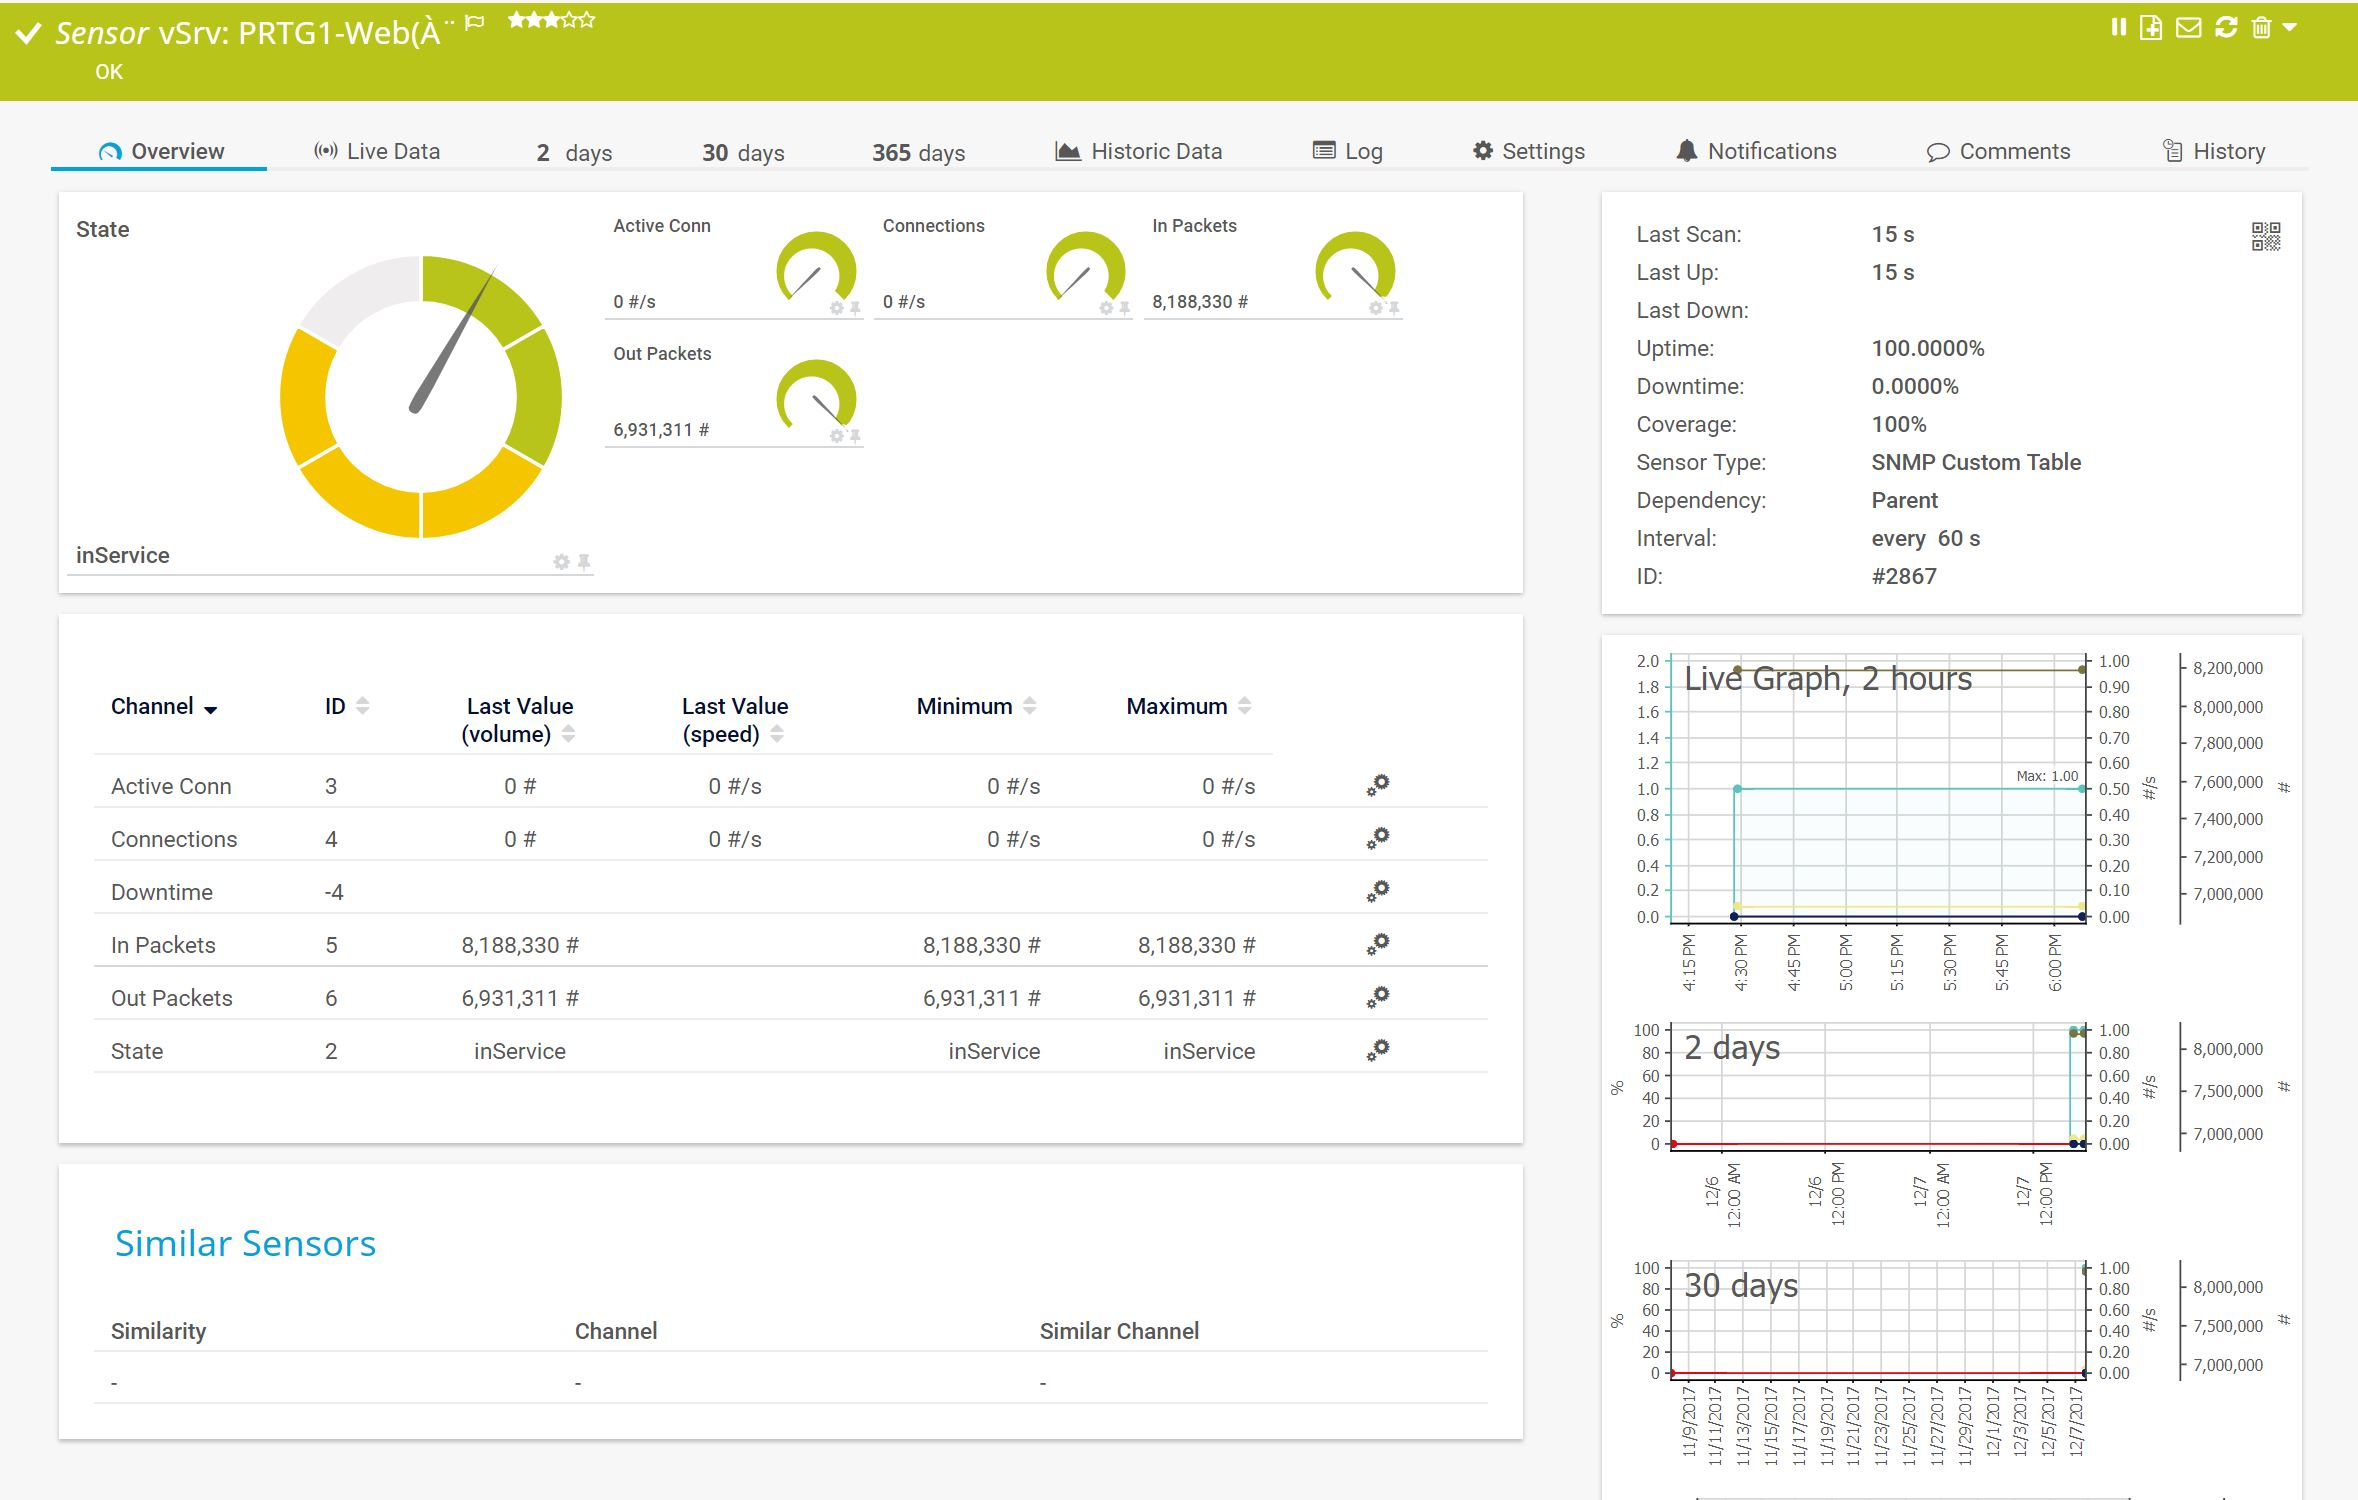
- Performance Metrics (creating one sensor for each virtual and real server)
- Connections
- Active Connections
- In Packets
- Out Packets
In particular, these are the sensors that measure the statistics related to the reverse proxy that does the SSL offloading for a PRTG remote probe and the PRTG web interface.
The device template creates the available and compatible sensors based on the data at hand. The sensors implement default alerts whenever possible, but you can still fine-tune most channels by defining additional limits in the sensor channel settings or by modifying the lookups that are included by default.
Requirements
- PRTG Network Monitor 17.4.35 or later
- Because the device template relies on the auto-discovery process, the device you want to monitor needs to be reachable via ping.
- SNMP must be enabled and the device must support the KEMP-MIB.
Known Issues and Limitations
- PRTG shows the alerts as reported by the monitored device via SNMP using lookups. If the status is not reported correctly via SNMP, PRTG cannot detect any issues. For additional alerts, set up limits for additional channels.
- The device template was created based on data collected from other customers, so we cannot guarantee that the sensors described above will work on your systems. Use these components at your own risk. Please test and validate the sensors in your environment after deploying them.
Deployment and Usage
- Download the ZIP archive that contains the template files from GitLab.
- Extract the archive and copy the content of the folder \PRTG to your PRTG program directory. By default, this is %Program Files (x86)%\PRTG Network Monitor\
- In PRTG, restart the core server: open Setup | System Administration | Administrative Tools | Restart Core Server and click Go!. This ensures that the MIB and lookups are loaded before you run the auto-discovery.
- Create a new device in PRTG with the address (IP or FQDN) of the device that you want to monitor and configure the SNMP credentials accordingly.
- Right-click your new device, select Run Auto Discovery with Template, browse for kemp and select the Kemp-LM template from the list.
Note: Using the auto-discovery with a dedicated device template is convenient here because it automates the creation of the custom sensors in an organized fashion.
- The sensors are deployed after a couple of seconds.
- You can modify the channel limits or lookups later.
Result
The created sensors look like this:
Sensor Overview

KEMP LoadMaster Health Sensor (enlarge)

KEMP LoadMaster Status Sensor (enlarge)
Device Overview
 KEMP LoadMaster Device (enlarge)
Troubleshooting
Have any issues? Please don't hesitate to contact us by replying to this post or via a support ticket. Please make sure to mention this article. Read ahead for troubleshooting steps that you can take in advance.
Auto-Discovery Log
Your auto-discovery log tells you a lot about what went wrong during the sensor's deployment. You can troubleshoot the auto-discovery by inspecting the auto-discovery log. If you get entries like the one below (NOT FOUND), it means that the required protocol or Object Identifier (OID) is not available and the sensors can't be deployed.
[...]
12/8/2017 2:37:59 PM: Template Loaded; Device ID: 2828; Name: Kemp-LM
12/8/2017 2:38:00 PM: Template Check; Device ID: 2828; Check ID: ping; FOUND
12/8/2017 2:38:01 PM: Template Check; Device ID: 2828; Check ID: snmp; FOUND
12/8/2017 2:38:02 PM: Template Check; Device ID: 2828; Check ID: snmpkemplm_rstable_index; NOT FOUND
[...]
In the example above, some sensors were skipped because the device did not respond to the snmpkemplm_rstable_index check. This means that this data is probably not available on your device. You can track this data by looking for the name after snmp_. In this case, a search for kemplm_rstable_index will tell you what OID from what MIB is missing.
You can also use this log to identify if the discovery was interrupted because the device did not respond to ping or to a basic SNMP check.
SNMP Data
If the discovery log is not sufficient, you can review the SNMP data directly from your device. To do so, save the text below (in the white box) as .txt and use it with the Scan Script option in our SNMP Tester. This will allow you to review which SNMP queries succeed and which do not deliver any data. Please have this information at hand when contacting our support team.
--------
Walk Default
--------
Uptime
walk=1.3.6.1.2.1.1.3
--------
MIB-2 System
walk=1.3.6.1.2.1.1
--------
Sensor Specific Queries
---
-->kemplm_health
Deamon State LKUP
walk=1.3.6.1.4.1.12196.13.0.7
---
HA State
walk=1.3.6.1.4.1.12196.13.0.9
---
Num Services
walk=1.3.6.1.4.1.12196.13.0.2
---
Current SSL TPS
walk=1.3.6.1.4.1.12196.13.0.12
---
Total Current TPS
walk=1.3.6.1.4.1.12196.13.0.11
---
CPU Usage
walk=1.3.6.1.4.1.2021.10.1.3
---
Total Memory
walk=1.3.6.1.4.1.2021.4.5
---
Available Memory
walk=1.3.6.1.4.1.2021.4.6
---
Uptime
walk=1.3.6.1.2.1.1.3
---
-->kemplm_rstable
rSstate
walk=1.3.6.1.4.1.12196.13.2.1.8
---
rSActiveConns
walk=1.3.6.1.4.1.12196.13.2.1.17
---
rSConns
walk=1.3.6.1.4.1.12196.13.2.1.12
---
rSInPkts
walk=1.3.6.1.4.1.12196.13.2.1.13
---
rSOutPkts
walk=1.3.6.1.4.1.12196.13.2.1.14
---
-->kemplm_vstable
vSstate
walk=1.3.6.1.4.1.12196.13.1.1.14
---
vSActiveConns
walk=1.3.6.1.4.1.12196.13.1.1.21
---
vSConns
walk=1.3.6.1.4.1.12196.13.1.1.16
---
vSInPkts
walk=1.3.6.1.4.1.12196.13.1.1.17
---
vSOutPkts
walk=1.3.6.1.4.1.12196.13.1.1.18
More
- Monitoring KEMP load balancers via REST API: The REST Custom sensor comes with a default template for KEMP load balancers. When adding the sensor, choose kemp.loadbalancer.template as REST Configuration file. The REST Custom sensor will monitor CPU usage, memory usage, and traffic on the KEMP load balancer, for example.


Add comment