I'm using the standard PRTG QNAP sensors, but they don't seem to "see" my expansion unit. How can I monitor this? I would like to monitor the expansion unit's hardware and also the disks from these other units.
1 Reply
Votes:
0
This article applies to PRTG Network Monitor 16.3.25 or later
Monitoring QNAP NAS Systems and Expansion Units
While we have some built-in sensors for QNAP in PRTG (Logical Disk, Physical Disk, System Health) they don't really support expansion units, because QNAP did a separate SNMP implementation for that.
I've put together a couple of lookups and a device template, which can be used to automate the deployment of these sensors using auto-discovery. The sensors will several metrics for any QNAP System (even without Expansion Units).
Adding Custom Sensors using the Auto-Discovery + Template
You can use the device template that we provide below to automatically create custom sensors with the PRTG auto-discovery.
The metrics that are available can vary. The sensors can monitor the following if the data is available:
- CPU
- Load
- Enclosure
- System Temp
- FAN
- Status
- Speed
- Physical Disk
- Smart Info
- Temperature
- Power
- Status
- Fan Speed*
- Temperature*
* = Will display -1 when readings are not available
The device template creates the available and compatible sensors based on the data at hand. The sensors implement default alerts whenever possible, but you can still fine-tune most channels by defining additional limits in the sensor channels settings or modifying the lookups included by default.
Requirements
- PRTG Network Monitor 16.3.25 or later
- Because the device template relies on the auto-discovery process, the device you want to monitor needs to be reachable via PING.
- SNMP must be enabled and the device must support the NAS-MIB.
Known Issues and Limitations
- The Enclosure sensors are based on the units serial number. If a unit is replaced (or for some reason the serial number changes) re-run the auto-discovery with the template.
- Default limits are present in the CPU Load, Enclosure and Physical Disk (Temperature) sensors. If that produces too much alerts in your deployment, adjust them as necessary.
- PRTG shows some of the alerts as reported by the monitored device via SNMP using Lookups. If the status is not reported correctly via SNMP, PRTG cannot detect any issues. For additional alerts, please set up limits for additional channels.
- This device template was created based on data collected from other customers, so we cannot guarantee that the sensors described above will work on your systems or that the default thresholds are optimal for your use case. Use these components at your own risk. Please test and validate the sensors in your environment after deploying them.
- The Power sensors will dsplay a Fan speed and temperature of -1 when no readings are available. If your sensors show meaningful values, you can optionally configure limits on these channels.
Deployment and Usage
- Download the required zip archive containing the template's files here.
- Extract the archive to your PRTG program directory. By default, this is %Program Files (x86)%\PRTG Network Monitor\.
- In PRTG, restart the core server: open Setup | System Administration | Administrative Tools | Restart Core Server and click Go!. This ensures that the MIB and lookups are loaded before you run the auto-discovery.
- Create a new device in PRTG with the address (IP or FQDN) of the device that you want to monitor and configure the SNMP credentials accordingly.
- Right-click your new device, select Run Auto Discovery with Template, browse for QNAP and select the Custom QNAP NAS-MIB v0.x template from the list.
Note: Using the auto-discovery with a dedicated device template is convenient here because it automates the creation of the custom sensors in an organized fashion. - The sensors are deployed after a couple of seconds.
- You can adjust the channel limits or lookups to your needs later.
Result
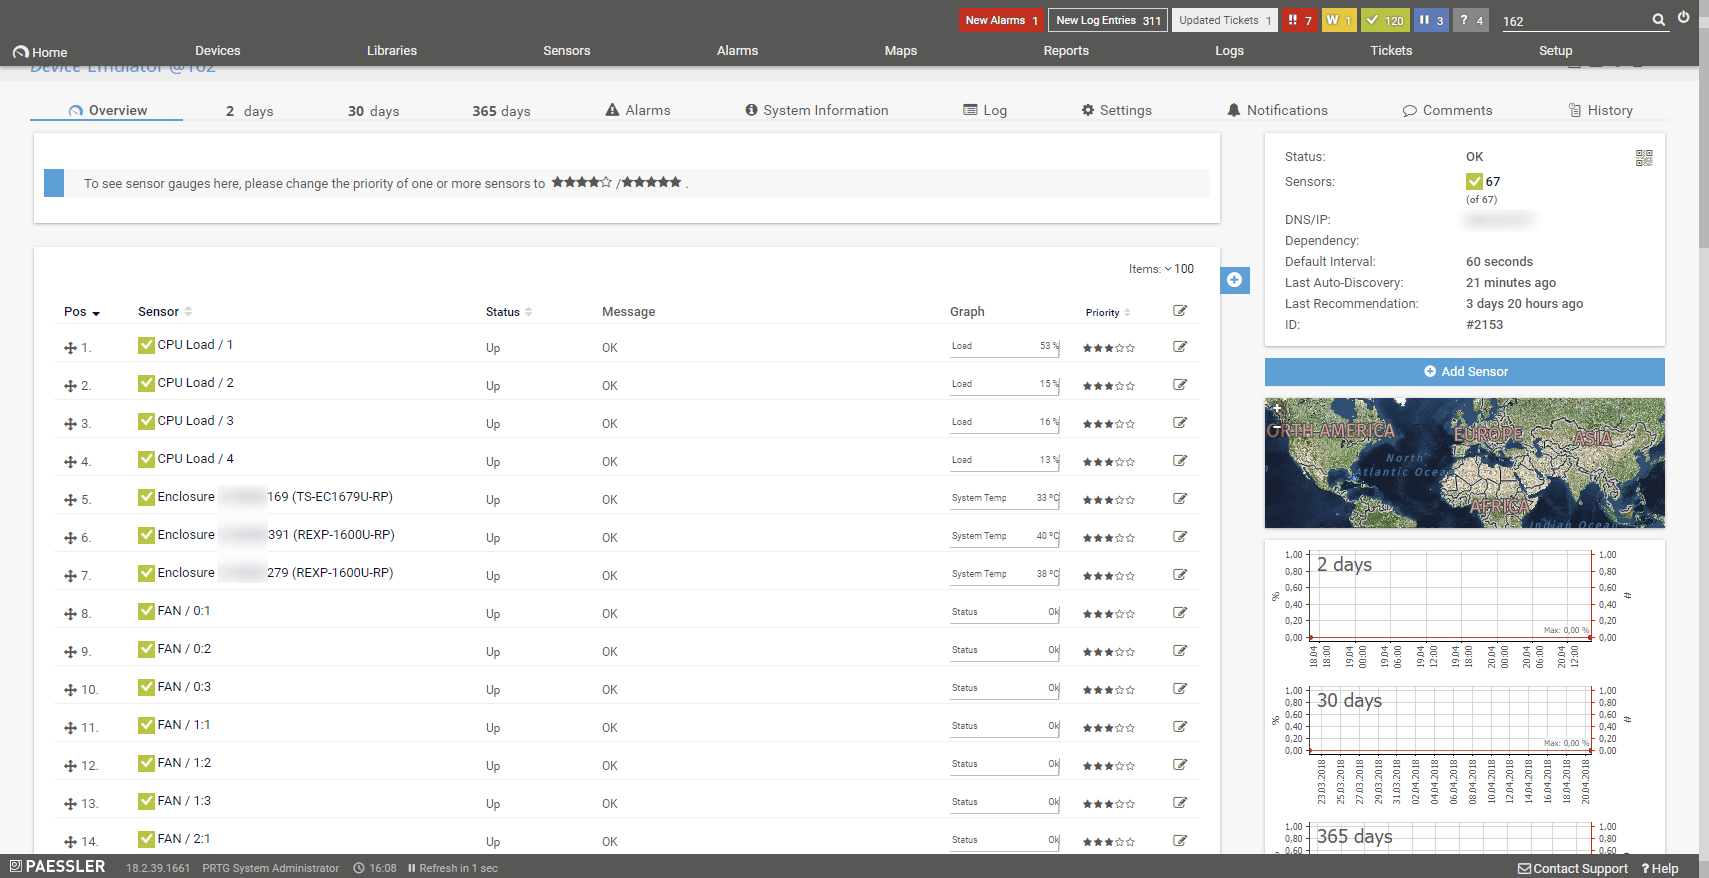
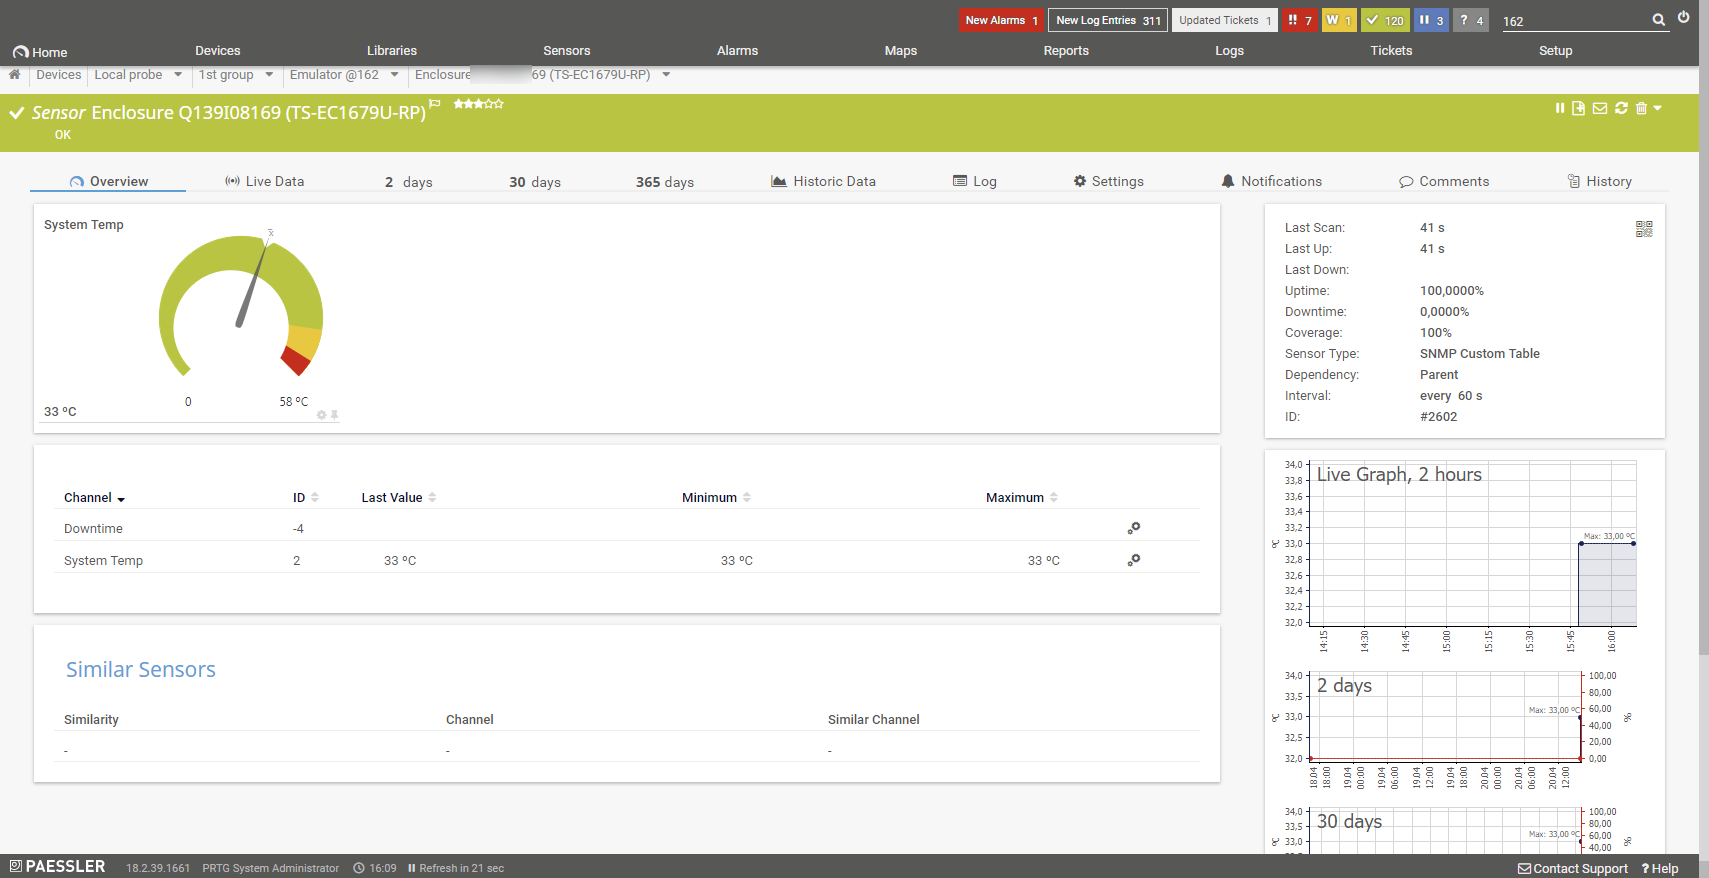
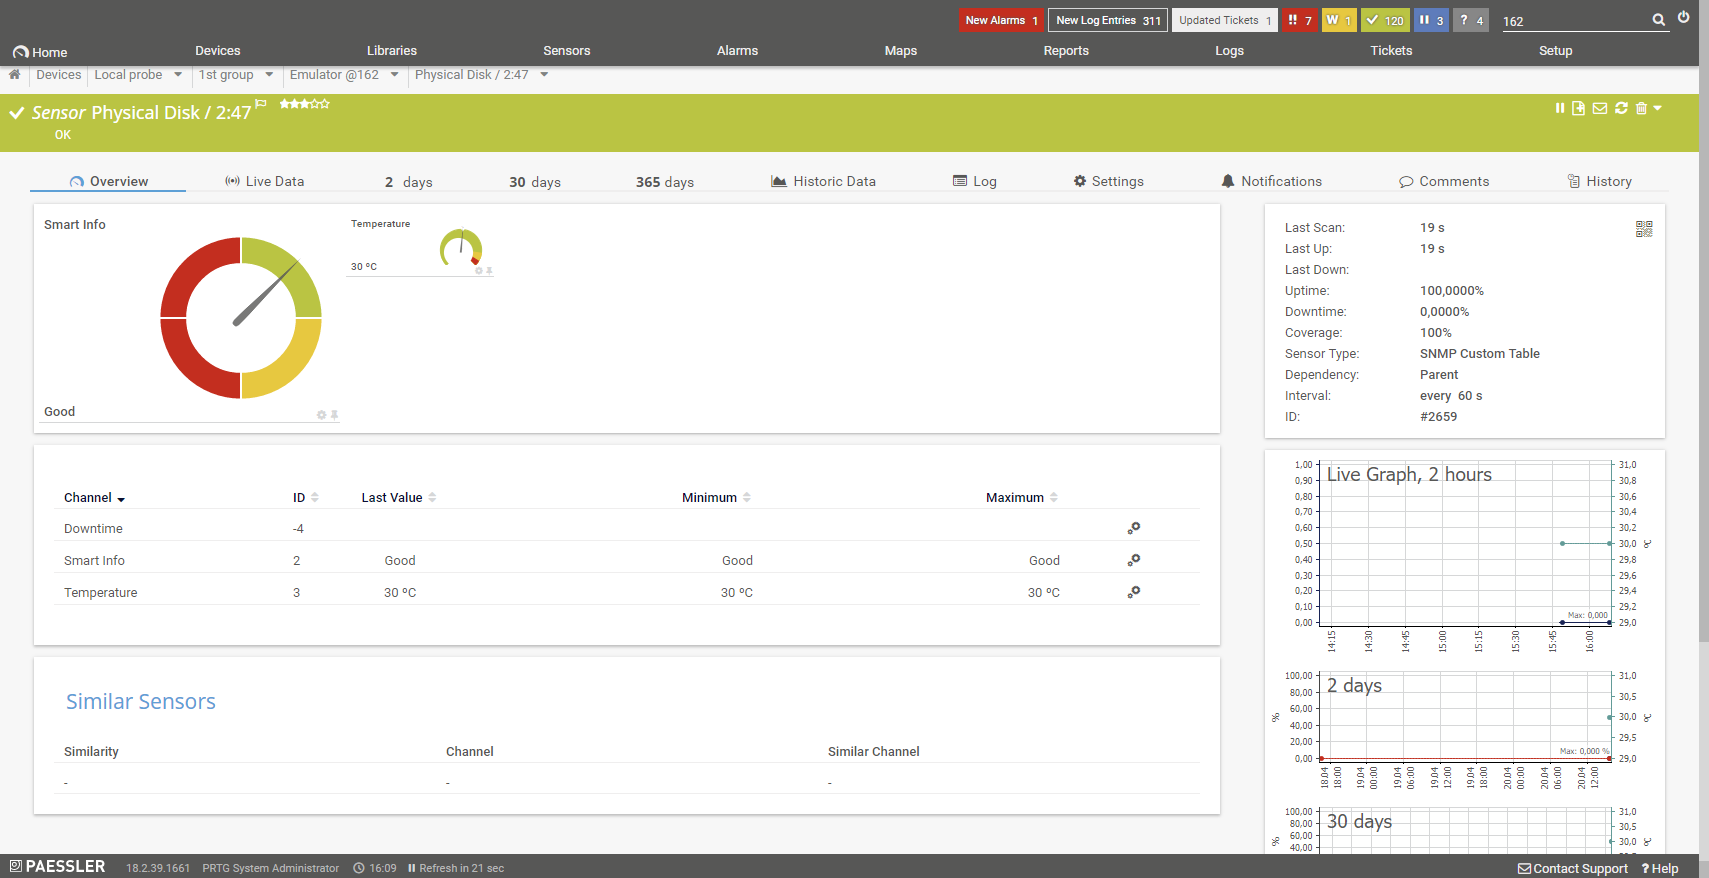
The resulting sensors will look like this:
Sensor's Overview
Device Overview
 Right-click and select Open Image in New Tab for full-screen view
Enclosure Sensor Overview
 Right-click and select Open Image in New Tab for full-screen view
Physical Disk Sensor Overview
 Right-click and select Open Image in New Tab for full-screen view
No sensors deployed? :(
Please read ahead for troubleshooting.
Troubleshooting
Have any issues? Please don't hesitate to contact us by replying to this post or via a support ticket. Please make sure to mention this KB post. Please read ahead for troubleshooting steps that you can take in advance.
Auto-Discovery Log
Your auto-discovery log tells you a lot about what went wrong during the sensor's deployment. You can troubleshoot the auto-discovery by inspecting the auto-discovery log. If you get entries like the one below (NOT FOUND), it means that the required protocol or Object Identifier (OID) is not available and the sensors can't be deployed.
[...]
21.08.2017 09:17:17: Template Loaded; Device ID: 22848; Name: Custom QNAP NAS-MIB v0.4
21.08.2017 09:17:18: Template Check; Device ID: 22848; Check ID: ping; FOUND
21.08.2017 09:17:19: Template Check; Device ID: 22848; Check ID: snmp; FOUND
21.08.2017 09:17:20: Template Check; Device ID: 22848; Check ID: snmp_enclosureTable; NOT FOUND
[...]
In the example above, some sensors were skipped because the device did not respond to the snmp_enclosureTable check. This means that this data is probably not available on your device. You can track this data by looking for the name after snmp_. In this case, a search for enclosureTable will tell you what OID from what MIB is missing.
You can also use this log to identify if the discovery was interrupted because the device did not respond to PING or to a basic SNMP check.
SNMP Data
If the discovery log is not sufficient, you can review the SNMP data directly from your device. To do so, save the text below (in the white box) as .txt and use it with the Scan Script option in our SNMP Tester. This will allow you to review which SNMP queries succeed and which do not deliver any data. Please have this information at hand when contacting our support team.
--------
Walk Default
--------
hrSystemUptime
walk=1.3.6.1.2.1.25.1.1
--------
MIB-2 System
walk=1.3.6.1.2.1.1
--------
Sensor Specific Queries
----
storageManager
walk=1.3.6.1.4.1.24681.1.4.1.1
---
Version History
| Version | Description |
|---|---|
| 0.4 | First Public version/release |
Best Regards,
Luciano Lingnau [Paessler Support]
Created on Mar 2, 2018 2:04:09 PM by
Luciano Lingnau [Paessler]
Last change on Jul 26, 2021 11:20:25 AM by
Maike Guba [Paessler Support]
(2,404)
●2
●1
Add comment