Can I monitor my NextGen (Mirth) Connect installation with PRTG? What steps do I need to take?
5 Replies
Votes:
0
This article applies to PRTG Network Monitor 18 or later
Monitoring NextGen (Mirth) Connect with PRTG
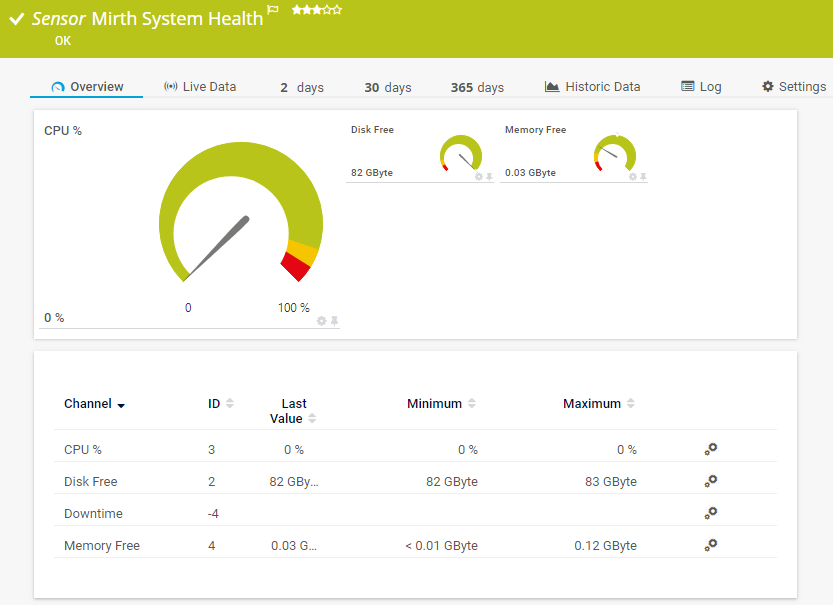
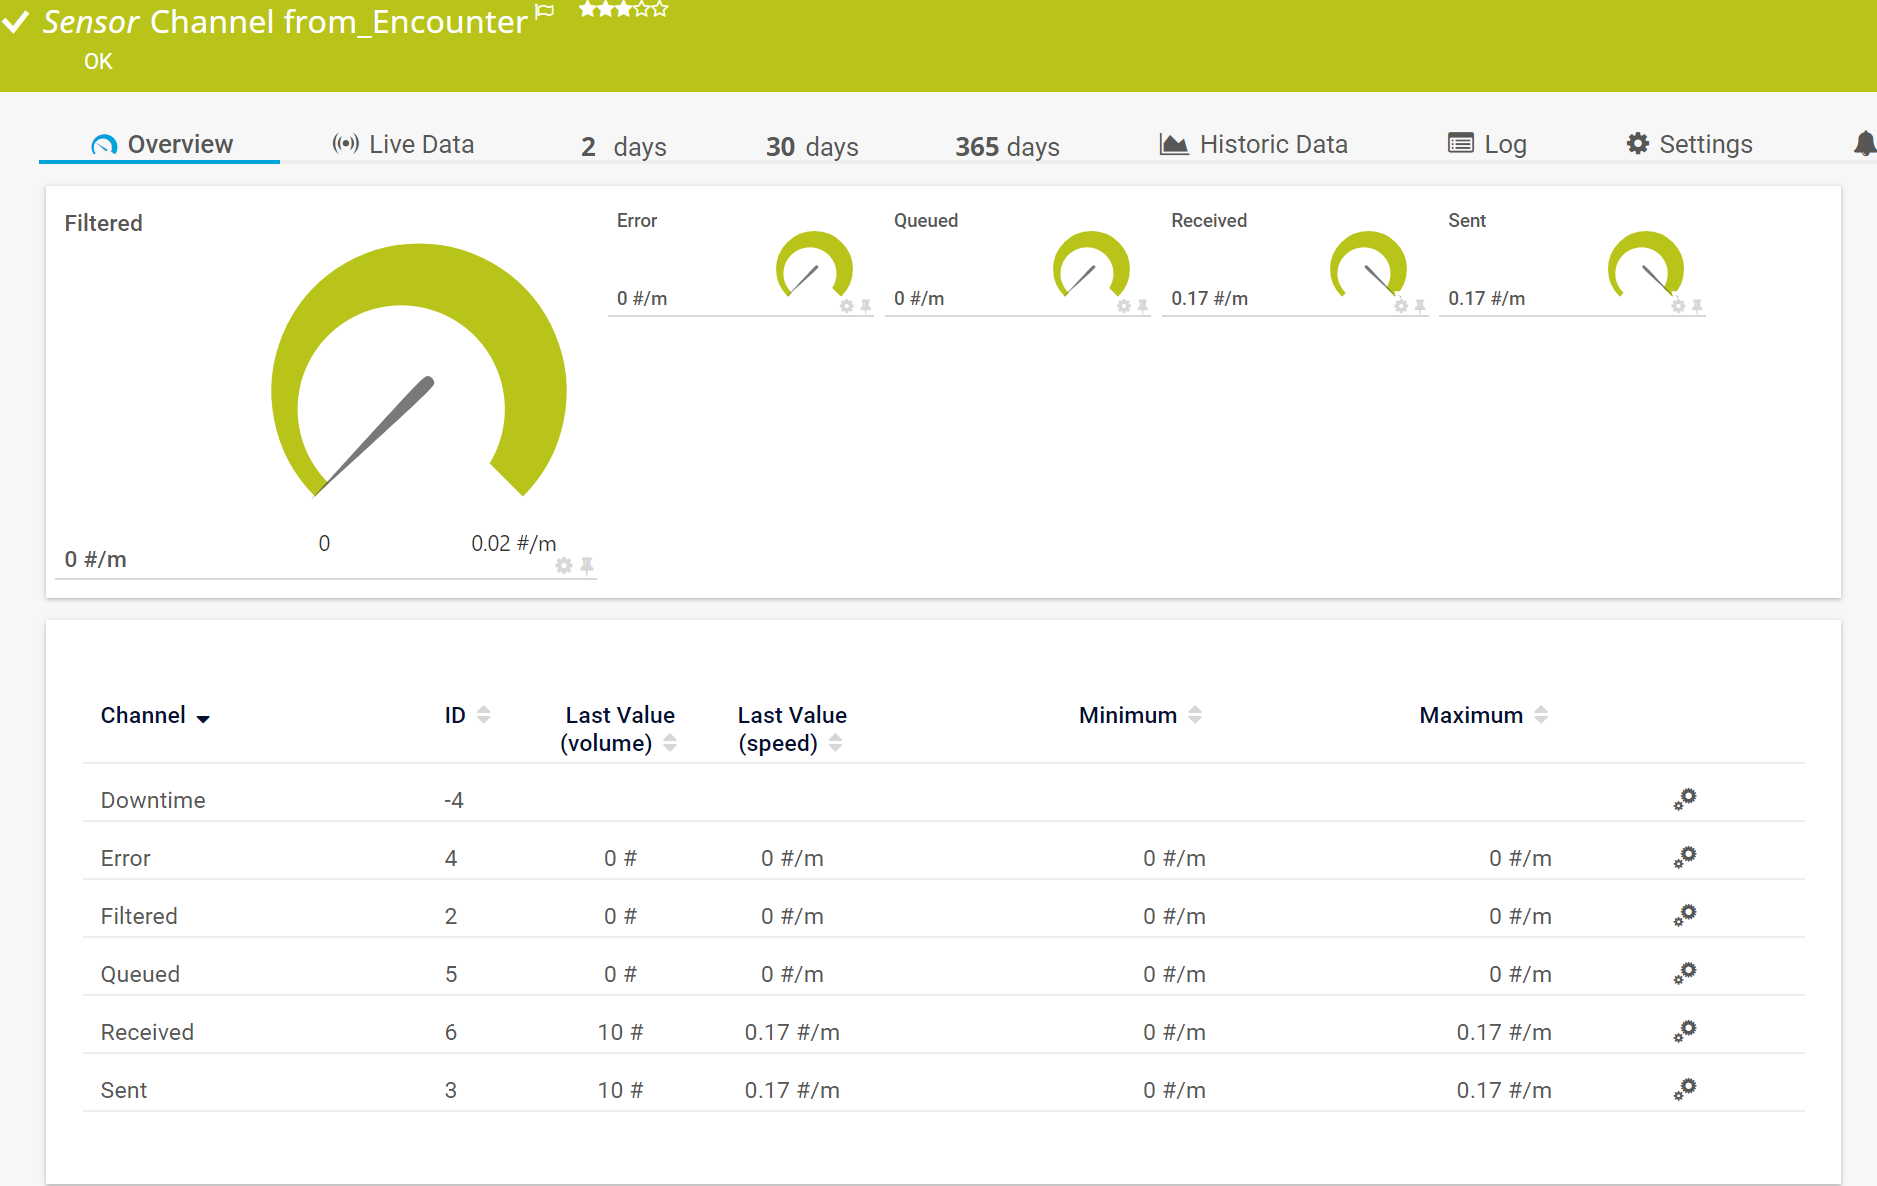
You can monitor your NextGen (Mirth) Connect communication server with the EXE/Script Advanced sensor from PRTG and a custom script. With the custom script, you can create a custom Mirth System Health sensor and a custom Mirth Channel Stats sensor. These sensors allow you to monitor important parameters of the communication server.
Create a New Device
- Create a new device in PRTG with the IP address of the NextGen (Mirth) Connect communication server. We recommend that you use a new device to avoid issues if the Linux credentials change.
- In the device's settings, enter your NextGen (Mirth) Connect username and password under Credentials for Linux/Solaris/Mac OS (SSH/WBEM) Systems.
- Click OK to continue.
Note: You can use a custom device template to automatically add the custom Mirth sensors to your device. See Auto-Discovery via Device Template below.
Monitoring Mirth System Health
You can monitor system health using the EXE/Script Advanced sensor and our custom script to create a custom Mirth System Health sensor. You can find the script in the PRTG eHealth-NEXTGEN-Connect project on GitLab. With this sensor, you can monitor
- CPU %
- Free Memory
- Free Disk Space
1. Copy the script prtg_mirth.ps1 and save it in the Custom Sensors\EXEXML subfolder of the PRTG program directory.
2. Create a new EXE/Script Advanced sensor.
3. Under EXE/Script select prtg_mirth.ps1.
4. Enter the following under Parameters
prtg_mirth.ps1 <IP/DNS> <port> <%linuxuser> <%linuxpassword> "system"
5. Replace <IP/DNS>, <port>, <username>, and <password>.
6. Click Create to add the sensor.
Monitoring Individual Interfaces
You can also monitor individual interfaces using the EXE/Script Advanced sensor and the same custom script as mentioned above to create a custom Mirth Channel Stats sensor. This sensor monitors the number of sent and received messages as well as faulty and buffered messages of the following channels:
- Received
- Sent
- Filtered
- Error
- Queue
Follow the same steps as with the custom Mirth System Health sensor but under Parameters, enter the following
prtg_mirth.ps1 <IP/DNS> <port> <username> <password> "channel" <channelID>
Auto-Discovery via Device Template
You can also use a custom device template so that PRTG regularly scans the device and creates sensors for newly added channels from Mirth.
- Copy the prtg_mirth_template.odt from the PRTG eHealth-NEXTGEN-Connect project on GitLab.
- Save it in the \devicetemplates subfolder of the PRTG program directory
- In the device's settings, go to section Device Type.
- Under Sensor Management, select the option Automatic sensor creation using specific device template(s).
- Select the template NEXTGEN (Mirth) Connect.
- Select a Discovery Schedule.
- Click Save to continue.
Debugging
For debugging purposes, you can also add the -Verbose parameter to enable logging to the console.
Created on Aug 15, 2018 11:32:46 AM by
Brandy Greger [Paessler Support]
Last change on Sep 5, 2018 7:47:09 AM by
Brandy Greger [Paessler Support]
Votes:
1
I can generate a support ticket if this is better served by that method? I have inherited this setup, so learning.... This is the error I receive when I run the system check:
XML: The returned XML does not match the expected schema. (code: PE233) -- JSON: The returned JSON does not match the expected structure (Invalid JSON.). (code: PE231)
Votes:
0
Hi there,
The knowledgebase is meant more for user to user interaction. If you need support, then please open a ticket under "support@paessler.com" or as described here:
https://www.paessler.com/manuals/prtg/support_contact_support
Best regards.
Votes:
0
I'm the same error
XML: The returned XML does not match the expected schema. (code: PE233) -- JSON: The returned JSON does not match the expected structure (Invalid JSON.). (code: PE231)
when apply EXE/Script Advanced sensor with prtg_mirth.ps1. How to fixed it?
Created on Jul 26, 2021 3:01:36 AM
Last change on Jul 26, 2021 6:32:17 AM by
Felix Wiesneth [Paessler Support]
Votes:
0
Hello alexlin,
please open a support ticket to "support@paessler.com" and we will continue there. Thanks!


Add comment