I received the sensor error code Connection could not be established (code: PE015) on some of my sensors and they stopped working. How can I solve this?
FeedWhy do I receive the sensor error message 'Connection could not be established (code: PE015)'?
Votes:
1
1 Reply
Votes:
1
This article applies as of PRTG 22
Troubleshooting 'Connection could be not established' error messages
What the error message means
The error message Connection could not be established (code: PE015) means that the RPC server of the targeted system could somehow not be properly accessed or queried by PRTG.
This error message is most likely caused by performance issues in regard to WMI-based sensors, for example too many WMI-based sensors per probe (either local probe or remote probe), or WMI-based sensors with scanning intervals that are too short.
Restarting the target system and the probe that has the affected sensors might momentarily solve the issue, but you should check the following solution in the long run.
The following sensor message within the Probe Health sensor can also indicate imminent issues and should be investigated.
| 350 % Delay (Interval Delay WMI) is above the error limit of 100 % Delay in Interval Delay WMI. WMI sensors of this probe cannot be scanned in their specified intervals. Try longer intervals or distribute load over probes. |
Identify the issue
The issue usually relates to a probe (either the local probe, cluster probe, or remote probe) and it is relevant to identify which probe is affected.
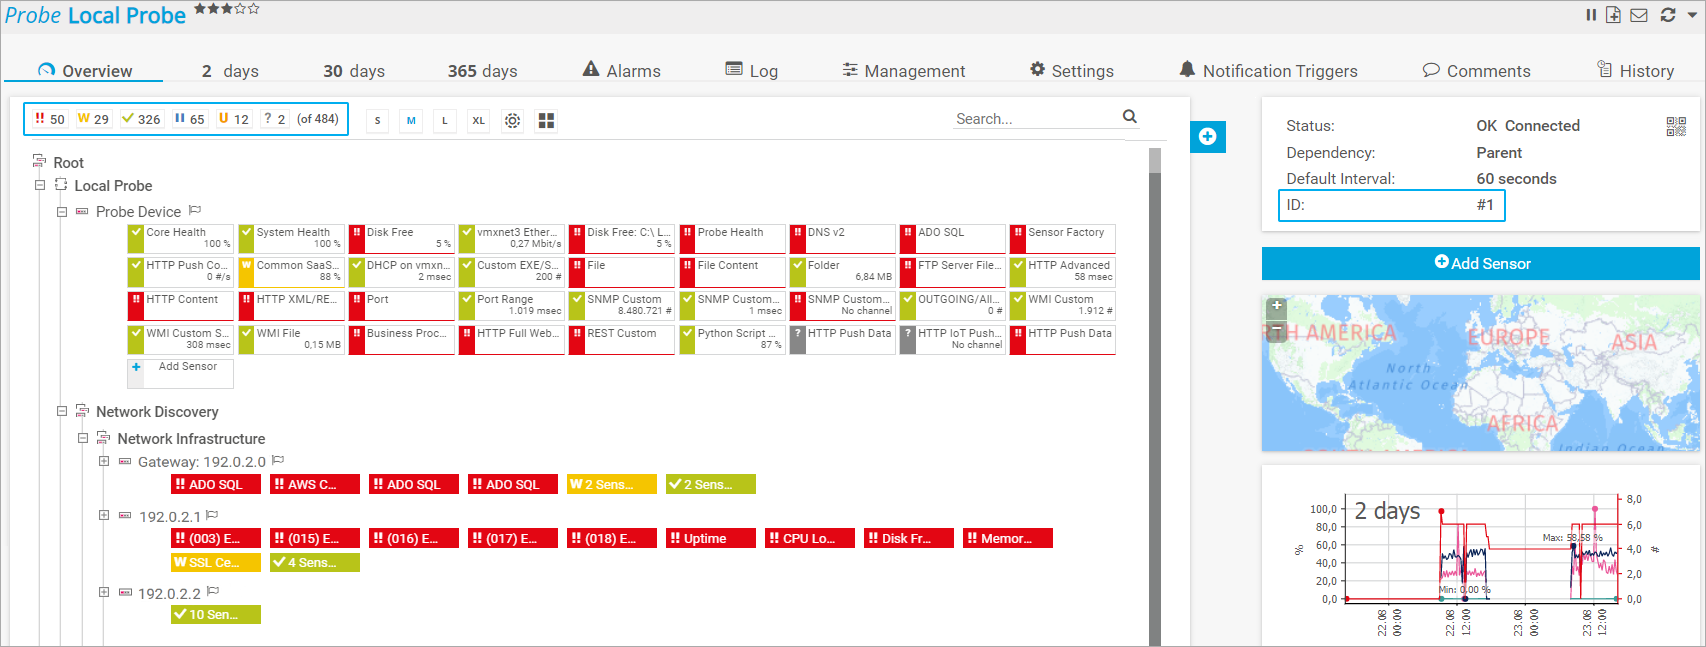
In PRTG, select the probe that has the affected sensors. This will provide you with two important pieces of information:
- The Sensor Status Bar that shows the accumulated states of all sensors for the current object (in this case, the selected probe), divided into the different sensor states.
- The unique Object ID of the selected probe.

Click to enlarge.
There is no rule of thumb or exact limit for the sheer number of sensors on a probe. Whether a probe tends to overload mainly depends on the chosen sensor types in combination with the configured scanning intervals.
For WMI-based sensors whose performance impact is high, try to stay below 200 sensors per probe.
Review your configuration
As explained above, the issue is usually a result of too many WMI-based sensors and/or scanning intervals that are too short.
To review the current configuration of the sensors of the affected probe, use the following API call:
/sensors.htm?columns=probe,device,name,type,interval,checkbox&filter_type=@sub(wmi)&filter_type=@sub(Windows)&sortby=interval&count=*&id=%id_of_probe%
Note: Replace %id_of_probe% with the actual Object ID of the affected probe.
Possible approaches to improve the situation
Increase scanning intervals
If the API call displays a lot of WMI-based sensors with a configured scanning interval of 60 seconds, consider increasing the scanning interval to 10 or 30 minutes for secondary sensors. For example, leave ping and other vital sensors with a short interval, but increase the interval for other sensors such as disk usage, which does not require immediate attention.
Increasing the scanning intervals will directly reduce the number of requests per second, which is likely what is keeping your system busy most of the time.
The easiest way to increase the scanning interval for multiple sensors at once is to use multi-edit.
Distribute the load among multiple probes
Install a remote probe to distribute the load by moving sensors to this probe. For more information, see PRTG Manual: Remote Probes and Multiple Probes.
Use SNMP-based sensors
Deploy SNMP-based sensors rather than WMI-based sensors because the SNMP protocol has a much lower impact on the probe than the WMI protocol. For pretty standard metrics in particular, there are great SNMP alternatives that provide you with the same information as their WMI counterparts:
- CPU load: SNMP CPU Load sensor
- Memory consumption: SNMP Memory sensor
- Disk usage: SNMP Disk Free sensor
- Bandwidth: SNMP Traffic sensor
- Uptime: SNMP System Uptime sensor
Note: To monitor a Windows client via SNMP, you must first enable the SNMP service on your OS.
It is also necessary to properly configure the incoming SNMP communication for PRTG. To do so, open the Settings tab of the device that has the SNMP sensors and configure the corresponding settings in the credentials for SNMP devices.
More
- For additional background information on sensor types and monitoring, see How can I speed up PRTG—especially for large installations?, particularly 4. Sensor Type and Monitoring.
- My WMI sensors don't work. What can I do?
- My SNMP sensors don’t work. What can I do?
- What does error code PExxx mean?
Created on Oct 10, 2018 3:43:55 AM by
Sebastian Kniege [Paessler Support]
Last change on Jun 15, 2023 6:50:28 PM by
Fruzsina Ébelle [Paessler Support]
Add comment