This article applies to PRTG Network Monitor 13 or later
The Reason for Unexplainable Spikes
If you find unexplainable spikes in graphs of your SNMP sensors, this most likely has to do with one of two main issues:
- a) PRTG Network Monitor is correctly reporting a spike
- b) PRTG Network Monitor is reporting a device error as a spike
To investigate further into the cause, you should first try to find a pattern in the spikes. For example, do they appear roughly at the same intervals or at the same time of each day? When you find a pattern, try finding other monitoring entries on the monitored system that match these patterns. Compare the pattern with processes on your network.
In the past, users of PRTG found out that scheduled backups, virus scanner updates, frequent reboots of a system, regular restarts of a specific service, and similar aspects directly or indirectly affected their network and monitored devices. Also a virus/malware outbreak or hacking attempt may cause sudden peaks. In all these cases, the peaks reported by PRTG were completely correct.
If you can't find a cause like this in your network, it may also be a device error or a bug in the firmware/software. Try finding information on this on the web. Maybe a firmware update is available.
Technical Background
Bear in mind that the main cause for erroneous peaks are so-called counter overflows.
Here is some technical background:
- Most SNMP devices use 32-bit counters to count the number of bytes transferred via a data line. Depending on the bandwidth usage the values will, at some point in time, reach the 32-bit barrier.
- In case of a real overflow, a counter reaches the maximum value (2^32) and continues counting from 0. PRTG detects this behavior and calculates the actual traffic in the overflow interval (2^32 - last value + current value).
- If the device malfunctions, the counter may be reset to 0 without reaching the maximum. PRTG interprets this as a counter overflow and will calculate a value which is much too high. A huge spike is shown in the graph.
- There is one special situation: In case of a system reset, the counter is usually also reset to 0. But this case can be detected by PRTG using the system uptime reading.
- If there is no uptime reading available on the device or the counter reset without a reboot (which should not happen based on the official SNMP specifications), the incorrect peak simply can not be detected by PRTG.
Solutions to This Problem
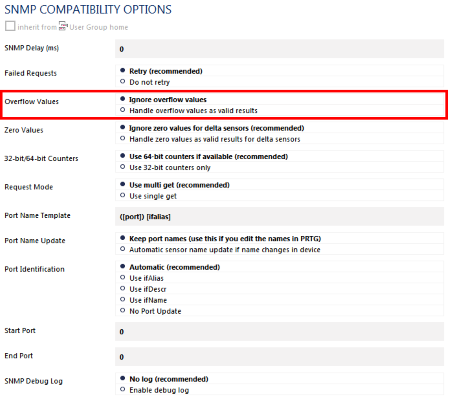
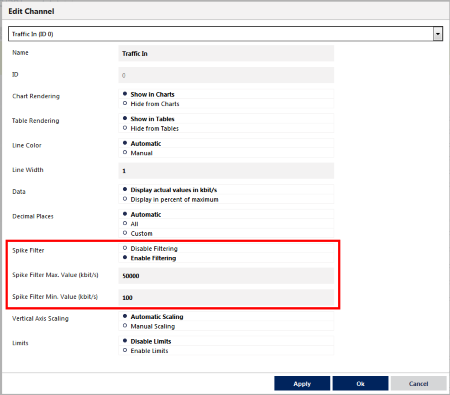
For devices with one of the limitations mentioned above, you can activate the Ignore Overflow Value option in the device settings or you can activate the Spike Filter in the sensor channel settings (see below).
But: We do not recommend removing peaks using PRTGs filtering mechanism if you are not certain that a buggy device is the reason for the peaks. Otherwise, you are filtering out real data that may be important for your monitoring data analysis.
You have two options as regards removing peaks.
Option 1: Set device to ignore overflow values
First, you can try the SNMP Compatibility Mode and set the device to ignore overflow values for SNMP sensors:
- In the PRTG web interface, choose your device from the device tree.
- Open Settings tab of the device.
- Scroll down to the SNMP Compatibility Options entry.
- Uncheck the Inherit checkbox. You can now change the compatibility options.
- In section Overflow Values, select the option Ignore overflow values (see screenshot below).
- Click on Save.

If this does not help, try option 2.
Option 2: Set spike filter in the sensor's channel settings
You can remove any peaks (including historic ones) using the Spike Filter in the sensor channels options. The value entered here is represented in the "raw" unit monitored by the SNMP sensor. For traffic sensors this is always bytes, independent of the unit setting.
- In the PRTG web interface, choose the sensor from the device or sensor tree.
- Open the Overview tab of the sensor.
- Open the settings of the desired channel by clicking the corresponding gear icon.
- Navigate to section Spike Filter and choose the option Enable Filtering (see screenshot)
- Enter max. and/or min. values for the spike filter.
- Click on Save

Option 3: Use SNMP v2c
- In case your target device supports and offers traffic counters with SNMP v2c, which is 64bit, please switch to this version in the settings in PRTG (Credentials for SNMP Devices) and add the sensors anew.
Important: Only switching to SNMP v2c but not adding new sensors will not make the sensors use 64-bit counters! Please make sure you add the sensors anew!


Add comment