I want to make a report showing the top 10 data users. can that be done?
Best Answer
Votes:
0
It's on the wishlist, I'm afraid that's all we can say in the moment.
26 Replies
Votes:
0
How are you monitoring the users, i.e. with what sensor type?
Votes:
0
the sensor that i need to monitor is auto discovered bandwidth sensor
Votes:
0
please take a look at the top 100 reports already included in PRTG
Votes:
0
I have looked at the top 100 reports and that only does the average. I want to do the top 10 and not the average but the top 10 with the highest overall data .
Votes:
0
What exact kind of sensors are you referring to here? And what exactly are you monitoring? Ports on a switch?
Votes:
0
I am monitoring Motorola wireless equipment using the bandwidth sensors to monitor it's Ethernet port.
Votes:
0
So, you do monitor 1 interface, which has traffic from multiple sources? I'm afraid then it's technically not possible with SNMP to see which source (user) created how much of the traffic then.
Votes:
0
No I am monitoring 1 interface for each source, not 1 interface with multiple sources. right now I have 1,000 unites that I'm monitoring via the bandwidth sensor for each unit. Now I want to see the top 10 bandwidth users out of that 1000.
Votes:
0
The only option would still be the "Top 100 Bandwith Report", which used averages for the speed values. The volume-values are not changed by the averages though. To only show the Top 10 though, it would be necessary to change the used template, respectively it's detail-htm-file, like for example the following changed 60 minutes version ("Stats Loop HiLo 60.htm" in the "\PRTG Network Monitor\website\reporttemplates\details" folder):
<!-- Template Stats Loop HiLo 60.htm-->
<h2>
<span style="<#clusterdependent showfor='clusterinstallation'>">
    <#lang key="html.reporttemplates.clusternode" default="Cluster Node"> <#cluster type="name" clgid="<@clgid>">:
</span>
<#lang key="html.reporttemplates.highest" default="Highest Averages"> (60 <#lang key="html.reporttemplates.minuteinterval" default="Minute Interval">)</h2>

<div><#report type="statstable" columns="sensor,average,minimum,maximum,probegroupdevice" count="10" avg="3600" sortby="average" showposition="true" clgid="<@clgid>"></div>
We would recommend to create a new report-template and a new detail-htm-file for this.
Votes:
0
when i do this it showing averages for a 60 min window. what if i want to know the results over a 30 day period?
Votes:
0
Of course you need to run the report with a period of 30 days then.
Votes:
0
so Highest Averages (60 Minute Interval) just means its, pulling the highest average every 60 min?
Votes:
0
That means a 60 minute average is built from the monitoring data (for example with a 1 minute scanning interval, 60 values would be taken and averaged). But this, as said, only applies for the speed values, the volumes are not averaged.
Votes:
0
I am not seeing the volumes in the graph I'm only seeing Average, Minimum, and Maximum values
Votes:
0
Yes, I'm sorry, the volumes are not included in this report. Sorry.
Votes:
0
What if i want to see the volumes is there a way to modify the stats loop hi li 60 to show that?
Votes:
0
I'm afraid that is not possible.
Votes:
0
so.... there is no report that i can run that will show total volumes....
Thanks for all your help!
Created on Jul 28, 2011 3:19:52 PM
Last change on Jul 28, 2011 7:26:17 PM by
Torsten Lindner [Paessler Support]
Votes:
0
Of course there is, the normal reports do show volumes.
Votes:
0
ok... then is there a way to have the normal data report be changed to show the top 10 data sensors?
Votes:
0
I do not see where the normal reports show the volumes. all the reports i have ran only show the averages on the sensors.
I am currently watching 25 bandwidth senors. what my goal is to do a report to show the top bandwidth senors total volume and not the average. I have a tag on each of the sensors so when i run the report, i tell it to pull that specific tag.
once i get this figured out i will be upgrading my sensors limit to unlimited.
thanks
Votes:
0
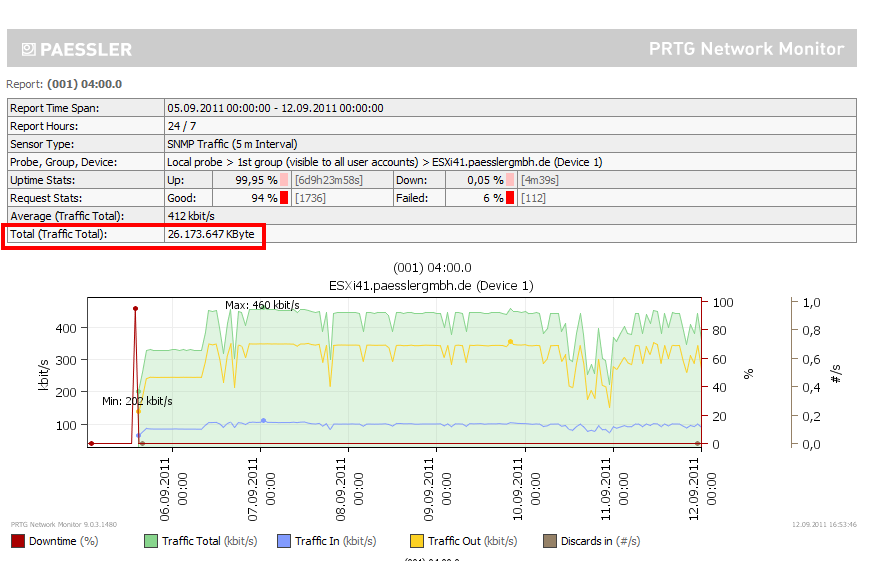
The normal reports on SNMP Traffic Sensors of course show reports, like the attached example of the Template (1h Graph, 1h Table-Averages):

And that volume is not averaged. It's the total volume from the reported period.
Created on Sep 12, 2011 2:55:25 PM by
Torsten Lindner [Paessler Support]
Last change on Sep 14, 2011 4:45:49 PM by
Torsten Lindner [Paessler Support]
Votes:
0
what report template are you selecting and is there a way to sort the report by most volume used to least volume used
Votes:
0
It's not possible to sort for the volumes, and the Template was, as mentioned, "Graph with Data Table - Graph 1 hour interval, Table 1 hour interval".
Votes:
0
Will this functionality implemented. It would be very useful to create more customized reports, and being able to sort the results of a report for Traffic Volume is essential.
Votes:
0
It's on the wishlist, I'm afraid that's all we can say in the moment.
Add comment