What is this?

This knowledgebase contains questions and answers about PRTG Network Monitor and network monitoring in general.

Learn more

PRTG Network Monitor

Intuitive to Use. Easy to manage.
More than 500,000 users rely on Paessler PRTG every day. Find out how you can reduce cost, increase QoS and ease planning, as well.

Free Download

Top Tags


View all Tags

"SNMP Traffic" sensor

Votes:

0

I monitors routers via "SNMP Traffic" sensor (bandwidthsensor, snmptrafficsensor) This sensor draws Graphs only for Traffic speed, and have Limits only for Traffic speed.

How can i get Graphs for Traffic volume? How can i enable Limits for Traffic volume?

prtg snmp traffic

Created on Jun 27, 2013 7:41:20 AM


Best Answer

Accepted Answer

Votes:

0

Hello jonny,
thank you for your reply.

In the current PRTG releases (17.x) you can use the "Historic Data Tab" to view the volume of any traffic sensor over any* period (period covered by the monitoring database). Enter the start and end period and generate the historic data report. The first table entries will give you the total volume (for Total, In and Out) over the whole period.

Please refer to the output below as an example:
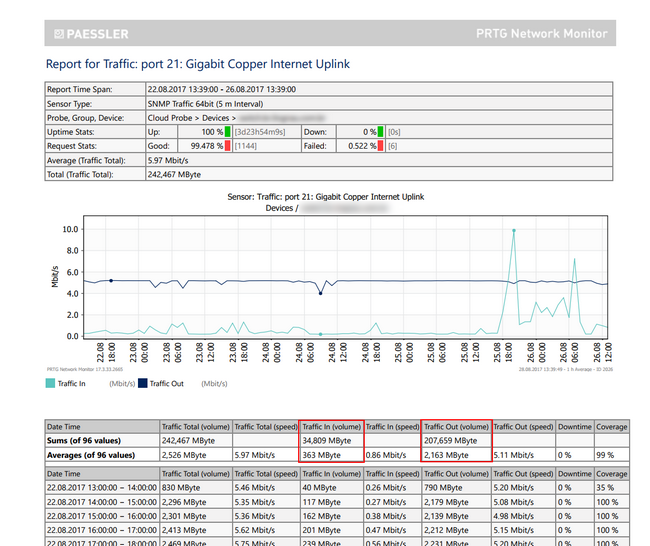
Image Click here for Full-screen view

If you need notifications for volume, you can use Volume Triggers.


Best Regards,
Luciano Lingnau [Paessler Support]

Created on Aug 28, 2017 11:48:50 AM by  Luciano Lingnau [Paessler]

Last change on Aug 28, 2017 11:51:04 AM by  Luciano Lingnau [Paessler]


8 Replies

Votes:

0

Hello,

you can add a volume trigger to your sensor.

Created on Jun 27, 2013 9:54:33 AM by  Aurelio Lombardi [Paessler Support]


Votes:

0

Volume trigger will not add Graphs for Traffic volume. I need to see Graphs.

Created on Jun 27, 2013 10:24:35 AM


Votes:

0

No, i need a Volume Graph that increases during a certain period (eg during the month 01.06-30.06), and resets to zero at the end of the period.

Created on Jun 27, 2013 11:59:11 AM


Votes:

0

so you want to sum up the volume over a certain period and then go back to 0 and start again.

this is not available in PRTG at the moment, but we will add this to our wish list and discuss the possibilities.

Created on Jun 27, 2013 12:17:47 PM by  Aurelio Lombardi [Paessler Support]


Votes:

0

Thank you!

Created on Jun 27, 2013 1:41:41 PM


Votes:

0

I am new to PTRG so please excuse revisiting old threads. I am looking for the same solution as the users described some years ago.

Did you add this functionality ? Cant find it on your resources. i.e. "to sum up the volume over a certain period" to determine data usage per IP on the network.

The solutions offered then were to: Use the "Volume Trigger: this works fine for an alert but it does not give historical picture of data volume usage. Integrating the Speed curve: have you added an internal tool to do this ? Seems clumsy to expect users to extract speed data and then integrate that to get picture of the Data usage status. Is it even possible to do that on a live basis ?

Created on Aug 25, 2017 9:10:46 AM


Accepted Answer

Votes:

0

Hello jonny,
thank you for your reply.

In the current PRTG releases (17.x) you can use the "Historic Data Tab" to view the volume of any traffic sensor over any* period (period covered by the monitoring database). Enter the start and end period and generate the historic data report. The first table entries will give you the total volume (for Total, In and Out) over the whole period.

Please refer to the output below as an example:

Image Click here for Full-screen view

If you need notifications for volume, you can use Volume Triggers.


Best Regards,
Luciano Lingnau [Paessler Support]

Created on Aug 28, 2017 11:48:50 AM by  Luciano Lingnau [Paessler]

Last change on Aug 28, 2017 11:51:04 AM by  Luciano Lingnau [Paessler]


Disclaimer: The information in the Paessler Knowledge Base comes without warranty of any kind. Use at your own risk. Before applying any instructions please exercise proper system administrator housekeeping. You must make sure that a proper backup of all your data is available.