This article applies as of PRTG 19
Custom monitoring of devices via SNMP
This is a guide to monitor your device if it supports SNMP. It provides the instructions for adding a new SNMP Library sensor to PRTG by importing an SNMP MIB file.
As an example, we use the MIB of Synology, but the approach applies to almost all MIB files and systems.
Note: PRTG already comes with a built-in SNMP Synology Logical Disk sensor, SNMP Synology Physical Disk sensor, and an SNMP Synology System Health sensor for Synology NAS systems.
Step 1: Ensure that your device supports SNMP
- Begin by confirming that your device supports the SNMP protocol. Check your device's data sheets, the vendor's website, or the device's configuration. SNMP is a standard protocol and most enterprise-grade devices offer SNMP support to some extent. In any case, we recommend that you double-check.
- Enable SNMP on the target device. For SNMP versions v1 and v2c, it is usually sufficient to set an SNMP Community String, but some devices have more complex configurations (like allowed managers, and more). Usually, the public string is used. This is also the default community string that PRTG queries.
See also How to Enable SNMP on Your Operating System and My SNMP sensors don’t work. What can I do?
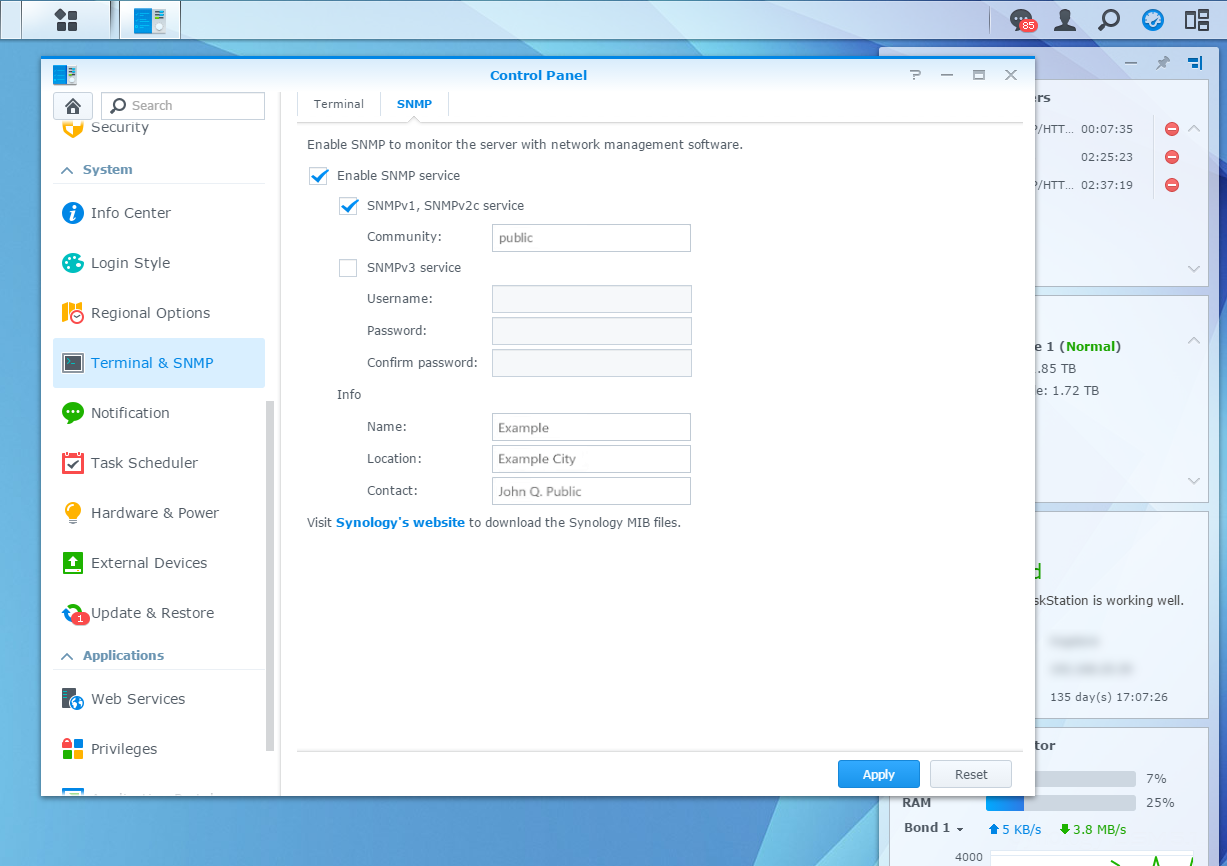
Click to enlarge.
- If the device does indeed support SNMP and you enabled it, test the functionality with SNMP Tester. The Read Device Uptime function is a great start. This test must yield a valid response (not 0). For a more sophisticated test, a Walk of 1.3.6 will confirm all OIDs that the device can reply to. For more details on this step, see How can I test the functionality of my SNMP device? and check the SNMP Tester Manual for more details.
- If SNMP still does not work, check the hints in SNMP doesn't work! Can somebody out there please help?!
Step 2: Acquire or download the SNMP MIB file you need
- The SNMP MIB is the file that contains the definitions for all OIDs that the device can reply to. It defines what a value is, what name describes that value, and so on.
Note: In some cases, not all OIDs are listed in one single MIB file. Therefore, you might need to provide two (or more) MIB files.
Here are some places you can go to for finding the SNMP MIB files for your device:
- The web interface of the target device
- A default location on the file system of the device
- The website of the device vendor
- The vendor's support
- The internet as described in Where can I find MIB files for my device?
- The MIB files are provided as ZIP files or as individual downloads, usually in .my, .mib, or .txt format. It is important to move or extract all MIB files to one single folder (if you have more than one) so that during the import any MIB dependencies can be resolved.
Step 3: Import the MIB file to PRTG
- The import process is necessary because it converts the MIB file that is written in Abstract Syntax Notation 1 (ASN.1) to a more performance-friendly format that PRTG understands. Use Paessler MIB Importer and follow the steps below. For more details, see the MIB Importer Manual or the article How can I import my MIB files into PRTG?
- Import the extracted MIB files by selecting File | Import MIB File | Select File(s) from the main menu of Paessler MIB Importer. The importer will display statistics regarding the number of imported OIDs and errors if there are any.
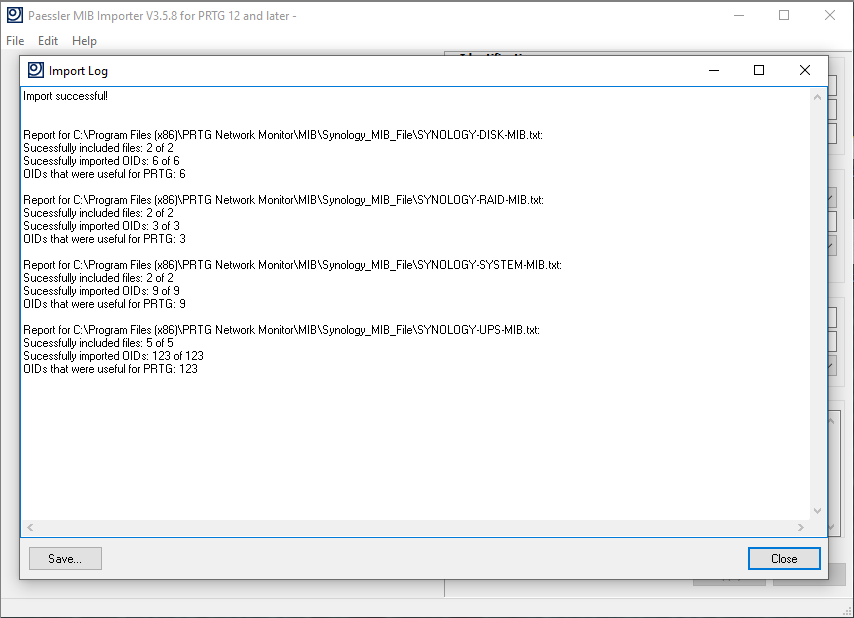
Click to enlarge.
- (optional) It is possible to edit/rename properties of the imported MIB file prior to using it in PRTG. This way, you can change the name of the sensor or channel to a friendlier description if you need to.
Note: In this step, you can review the channel's lookup in the description field. Remember the lookup information when writing a lookup definition (see step 4 as well).
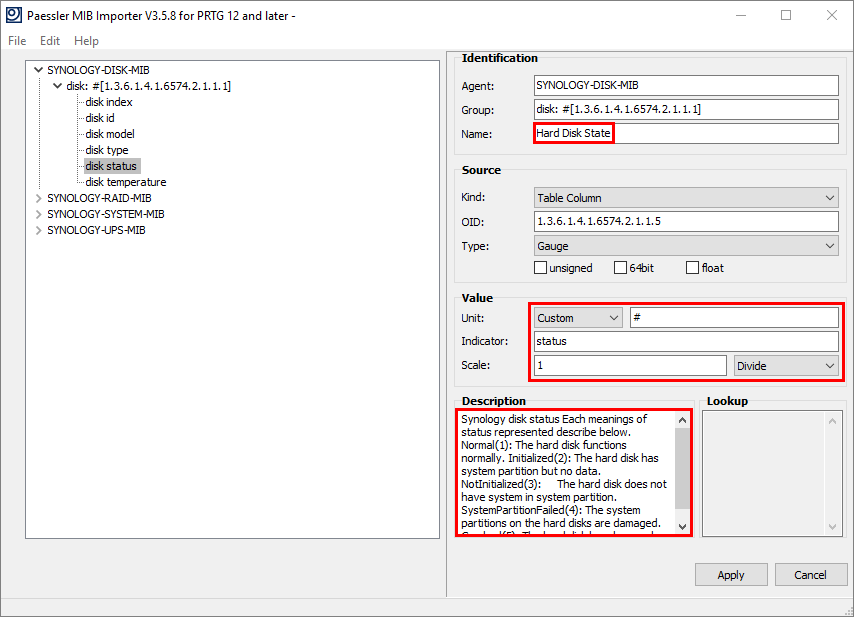
Click to enlarge.
- (optional) It is also possible to make a partial selection of the OIDs to include only the OIDs that you want in the final OIDLIB file for monitoring with PRTG. This can improve performance when adding a new SNMP Library sensor and it can create less visual clutter.
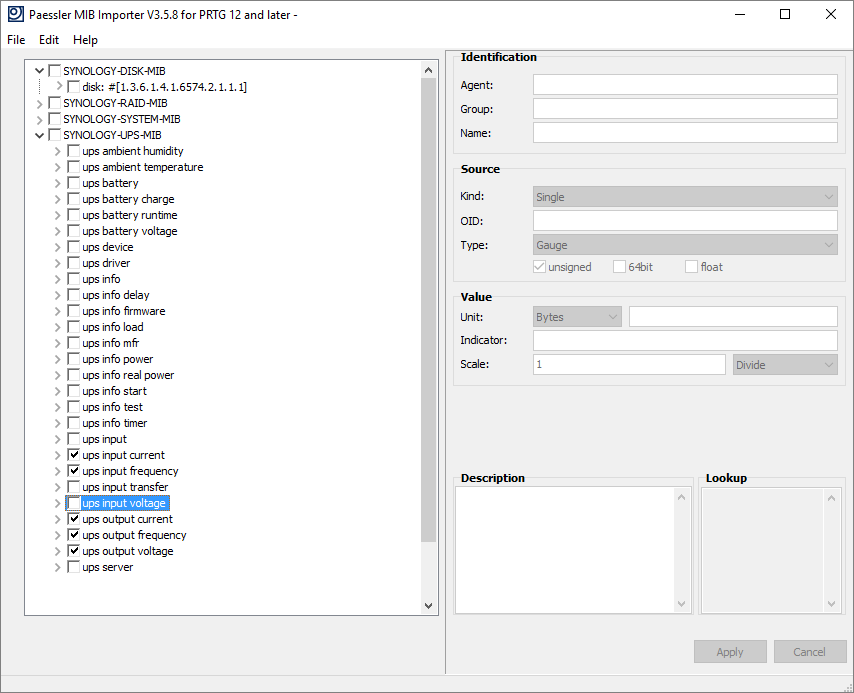
Click to enlarge.
- Save the resulting OIDLIB file to any location and copy it to the following program directory on the PRTG core server system: \PRTG Network Monitor\snmplibs\
You will see the files in this folder when you add a new SNMP Library sensor.
Note: When you are using PRTG Hosted Monitor, please contact our support team to upload the files for you (option available with PRTG version 20.3.60.1623 and newer).
Step 4: Add the sensors in PRTG
- Once you have completed the steps above, add a new device to PRTG that points to the target device you want to monitor. You have to provide a name and IP/DNS address. During sensor creation, you may also provide the SNMP credentials that the sensors of this device will use. You can also change this later.
- Right-click the previously created device to open the context menu, click Add | Sensor, and add an SNMP Library sensor. Select the name of the file that you previously copied to PRTG from the list and click OK.
PRTG now performs a meta-scan to check which of the OIDs contained in the OIDLIB file are actually available for monitoring on the device and lists them in a table. From the list, you can then select for which properties you want to create a sensor:
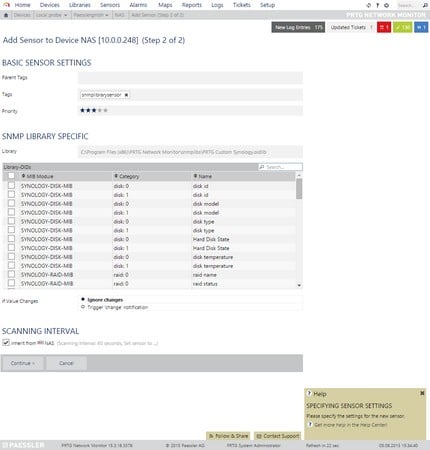
Click to enlarge.
If at this point, PRTG takes a long time to perform the meta-scan see MIB problems: PRTG hangs when adding SNMP library sensor.
Select the required properties (or all) and click Continue. After a few seconds, your PRTG will look like this:
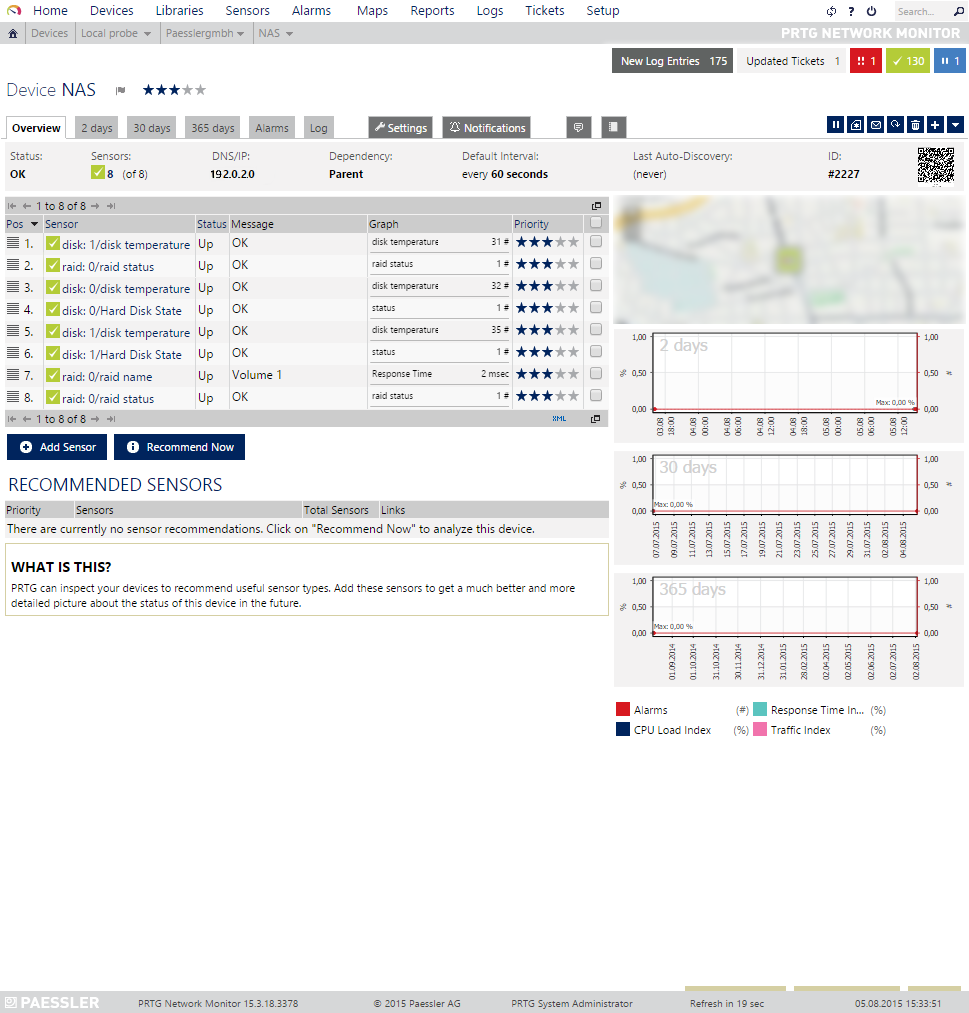
Click to enlarge.
- (optional) You can now configure limits for the created sensor channels.
Tip: If you have more devices that you want to monitor exactly the same way (using the same OIDs and limits), create a device template. It stores all the settings so that you only need to define them once. Let PRTG auto-discover the rest of your devices using the defined template and set up monitoring for you.
- Some sensors will display odd values, for example, the status 1 for a hard disk status. Define lookups in this case. You can define lookups to map the meaning of "0", "1", "2", or any other value for this sensor to more human-friendly and better understandable expressions like "Okay", "Error", or "Checking Status".
Once you created or configured a lookup file and imported it, the sensor will report the status like this:
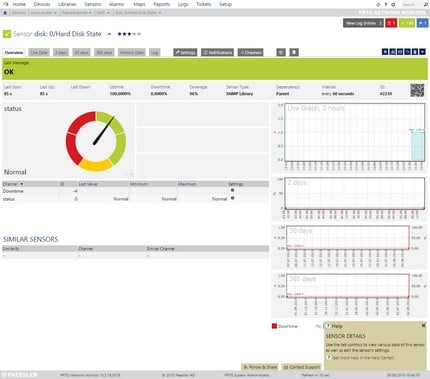
Click to enlarge.
Tip: For a more detailed lookup guide, see Value interpretation (aka Lookups)
More


Add comment