We've been using the Maps feature in PRTG and like it, but the amount of displayed information and the font size is too small. We've tried fiddling with the CSS, but it's becoming difficult to maintain.
Are there any alternatives that we could use?
Votes:
We've been using the Maps feature in PRTG and like it, but the amount of displayed information and the font size is too small. We've tried fiddling with the CSS, but it's becoming difficult to maintain.
Are there any alternatives that we could use?
4k css customization grafana maps prtg
Created on Jan 4, 2018 10:02:37 AM by
Stephan Linke [Paessler Support]
Last change on Jan 18, 2018 5:56:18 PM by
Gerald Schoch [Paessler Support]
63 Replies
Votes:
Unfortunately, the development of the plugin has ceased to continue, please consider this guide outdated as it simply might not be compatible with new PRTG or Grafana versions. The last commit was made a year ago, so you might run into inconsistencies.
Update 01/2020
Seemingly, the author of the update started to work on it again to fix most quirks. From some testing, I can say that it actually works again now :) Please make sure that you follow the instructions on the Github page and that the time and date format of the user account [within PRTG] is configured as
MM/DD/YYYY HH:MM:SS (AM/PM), otherwise it may not work properly.
With large displays becoming more affordable, dashboards in IT departments are using higher resolutions and are placed in prominent places within the office or building. This leads to some issues with the current implementation of Maps in PRTG. The map objects are modifiable to a certain extent, but their modification is somewhat tedious and may lead to unforeseen results in other areas of PRTG.
Within Tech Support, we have gone through various iterations of the dashboard within our office.
We started with Maps in PRTG, which at some point were hard to read from a distance. We came up with a
custom CodeIgniter application that was readable, but hard to maintain or extend. Adding a new sensor to the overview or a new clock item took quite some time. It worked, but other departments wanted the new dashboard as well, with different metrics and features, of course.
At this point, the application would no longer scale properly. So we tested a few applications and ended up sticking with Grafana due to its extendability, ease of use, and administration.
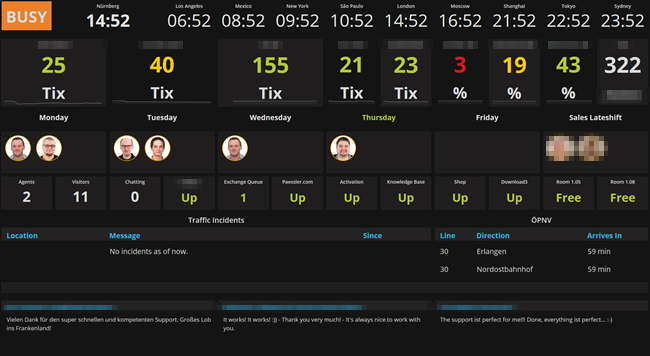
For our Tech Support Dashboard, we also use MySQL to retrieve current traffic information, public transport information, and motivational quotes from our customers. The dashboard also shows several clocks for scheduling remote sessions, counters for internal metrics, late shift coverage, and system availability.
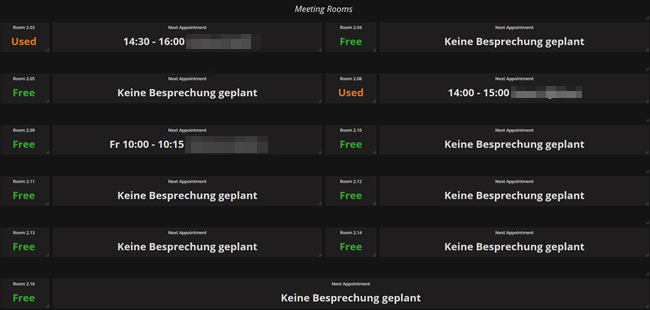
Another example is our meeting room dashboard that shows if a meeting room is occupied and if there are any upcoming appointments.
This is just the tip of the iceberg. There's much more that you can do with Grafana because it's not limited to retrieving values from PRTG.
Grafana is available as a Windows binary, so this is probably the easiest way to install. Of course, there are also other ways of installing it, including Docker. It's explained thoroughly there, so we won't cover the process in this article in further detail.
Before you start Grafana for the first time, navigate to <Grafana Installation Directory>/bin and execute the following command to install the plugin that will allow communication with PRTG:
grafana-cli plugins install jasonlashua-prtg-datasource
If the installation was successful, the output should look like this:
installing jasonlashua-prtg-datasource @ 4.0.3
from url: https://grafana.com/api/plugins/jasonlashua-prtg-datasource/versions/4.0.3/download
into: ../data/plugins

[32m✔[0m Installed jasonlashua-prtg-datasource successfully

Restart grafana after installing plugins . <service grafana-server restart>
After restarting Grafana, the data source should be available.
Start Grafana and navigate to Data Sources and click +Add data source. Configure as follows:
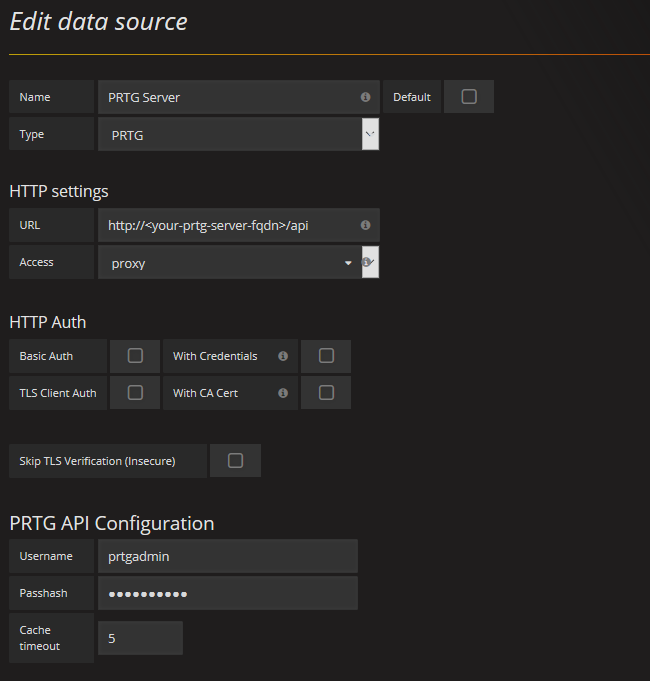
Click Save & Test and you should see something like this:

Restart the Grafana service. Otherwise, reading from PRTG may not work.
Congratulations, Grafana is now configured to read values from PRTG!
Note: There are several other settings to configure within Grafana (different users, TLS, ports, etc.) that are not covered by this article. Please refer to Grafana's documentation for further configuration information.
Navigate to Dashboards and click +New. You have several options for displaying the values. For now, only Graph, Singlestat, and Table, since these are compatible with the PRTG plugin. Dashboards use a row/column-based layout that allows you to easily move objects and add new rows.

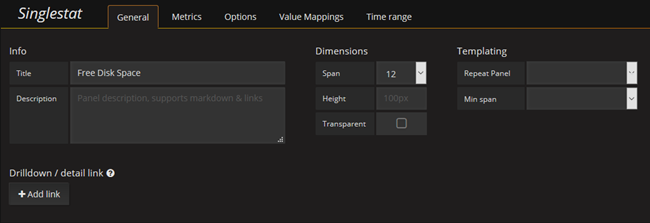
This panel shows you a sensor's value or message. Let's say you want to display a certain value of a channel and make it turn red, yellow, or green when certain thresholds are exceeded. Simply create a new Singlestat panel and configure it as follows:
 Click here for original image
Now, you can enter something in Group, Host, Sensor, or Channel, or use the dropdown menus to see a list of available items in the corresponding category, similar to this example:
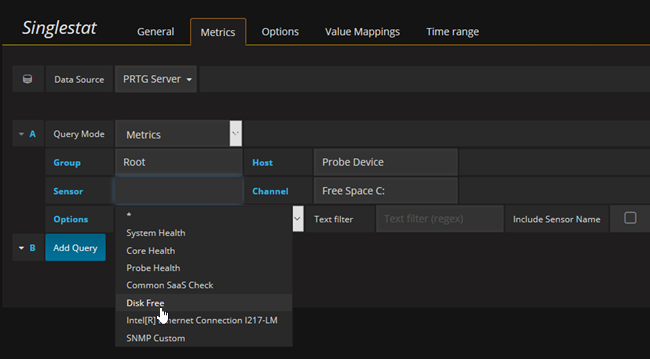
This will allow you to filter for the correct object. Now click the Options tab.
 Click here for original image
Under Coloring, configure the Thresholds accordingly to match the sensor limits. You can also make other settings, for example, change the font sizes.

In terms of layout, graphs in Grafana are similar to graphs in PRTG. The settings are basically the same as for the Singlestat object. There are more options for configuring the graph, for example, axes and legend. You can also add multiple sensors to the graph, just like in the Sensor Factory Sensor. Simply click the Add Query button to add additional sensor channels.
You can also modify the time range covered by the graph. You can also zoom in on areas, simply by selecting the area.
See Grafana's Graph Panel Documentation for more information.

If you have used PRTG Maps, you're probably familiar with these kinds of tables. You can also set them up in Grafana via the Table panel. Configure the Metrics tab as follows:
| URI | table.json |
|---|---|
| Query String | content=sensors&columns=device,sensor,status,message,downtimesince&filter_status=4&filter_status=5 |
This will display the sensors that are currently in a Warning or Down status. Configure the Options tab as follows:
 Click here for original image
 Click here for original image
The other columns can be styles as well. This is useful if you need custom headers. The rows will be colored according to their state now.
| Question | Why do the values shown in Grafana not match with PRTG? |
|---|---|
| Answer | Check the timing in the top right. Set the quick range to Last 5 Minutes. Make sure that the Value Stat is set to Current, as it defaults to Average |
| Question | Can I have map rotation just like in PRTG? |
|---|---|
| Answer | Please check Grafana's Playlist feature: http://docs.grafana.org/reference/playlist/ |
| Question | Can the threshold colors be modified? |
|---|---|
| Answer | Yes, but they have to be changed for each panel. Click the panel and then the "burger" menu. Click Panel JSON to modify the source of the panel. Search for the colors and replace them with "rgba(180, 204, 56, 0.99)", "rgba(255, 203, 5, 0.99)", "rgba(215, 25, 32, 0.99)" |
| Question | How does the weekday indicator work? I can't find anything like it... |
|---|---|
| Answer | It uses an invisible text panel with the mode set to HTML with the JavaScript code at the bottom of the page. It will set the weekday text of today (see Examples) to green |
| Question | Is there a Kiosk mode in Grafana so that the menu is hidden? |
|---|---|
| Answer | Sure, simply add &kiosk to the URL of your dashboard. It will hide all control elements. |
| Question | Can the refresh rate be changed via the URL? |
|---|---|
| Answer | You can control this by changing &refresh=1m within the URL. Simply change the number to what you prefer. |
This FAQ will be extended as more questions come in.
<h3 id='weekdayThursday' style='font-weight:bold; text-align:center'>Thursday</h3>
<script type='text/javascript'>
function refresh() {
 // weekday highlightning
switch((new Date).getDay()){case 0:day="weekdaySunday";break;case 1:day="weekdayMonday";break;case 2:day="weekdayTuesday";break;case 3:day="weekdayWednesday";break;case 4:day="weekdayThursday";break;case 5:day="weekdayFriday";break;case 6:day="weekdaySaturday"}document.getElementById(day).style.color="#b4cc38";
}
</script°
Created on Jan 4, 2018 10:51:16 AM by
Stephan Linke [Paessler Support]
Last change on Jan 21, 2020 7:59:37 AM by
Stephan Linke [Paessler Support]
Votes:
Does this work with the latest PRTG 18.X version?
I am having issues getting it to even authenticate when creating the data source. When I click 'Save and Test' in Grafana it throws a red exclamation error (no error codes).
Thanks!
Votes:
Stumbled upon that as well, make sure the following remarks are checked:
Kind regards,
Stephan Linke, Tech Support Team
Created on Jan 24, 2018 7:17:31 AM by
Stephan Linke [Paessler Support]
Last change on Jan 24, 2018 7:17:58 AM by
Stephan Linke [Paessler Support]
Votes:
Same here. Used the Windows ZIP version. Download, extract, start. When I try to add the the datasource I just get a red bar with no text as error.

Created on Jan 24, 2018 2:41:30 PM
Last change on Jan 24, 2018 3:13:04 PM by
Stephan Linke [Paessler Support]
Votes:
Anything in the browser console?
Kind regards,
Stephan Linke, Tech Support Team
Votes:
Which Grafan installation do you use? The windows Binary or Docker, Linux one? Which version, I checked with 4.6.3 December 14th 2017
What do you mean by "browser console"? The server console does not state any error.$ The firefox debugger console I am not very familiar with, so
Votes:
I'm using the Windows binary, same version :) Have you tried restarting Grafana already?
Votes:
I was able to get authentication to work with the latest version of PRTG and Grafana, however when creating dashboards and having the data source as PRTG selected, nothing populates in any of the fields for metrics, even when attempting to enter manually it just shows a query error.
Votes:
So you're just seeing stars in the dropdown? Did you restart Grafana and force-refresh your browser? I'm not entirely sure why this happens, but I can redeem this by doing the steps described and most of the time, it works afterwards...
Kind regards,
Stephan Linke, Tech Support Team
Votes:
Force refresh of the browser did it, not sure why that didn't click, thanks :).
Votes:
Make sure to update that reddit thread as well ;)
Kind regards,
Stephan Linke, Tech Support Team
Votes:
One thing I noticed is that even with refresh on a dashboard on, a table showing alerts or warnings etc (as shown in this thread) does not update.
For example, if an alert fires for a down sensor, it does not show up on the dashboard unless the page is refreshed, while other elements on the page are properly refreshing normally such as bandwidth sensor graphs.
Votes:
Created on Feb 3, 2018 12:30:35 PM by
Stephan Linke [Paessler Support]
Last change on Feb 3, 2018 12:30:52 PM by
Stephan Linke [Paessler Support]
Votes:
Yes it is.
Votes:
What does your URL look like (i.e. the one you're using for your dashboard)? Feel free to remove the FQDN part.
Votes:
/dashboard/db/itmon02?refresh=5s&orgId=1&kiosk
Votes:
You might want to try 1m instead of 5s - let me know if that worked :) Is the table paged by any chance (i.e. not enough height to display all rows)?
Votes:
I'm trying to get data with the raw query mode
getobjectstatus.htm and querystring id=9122&name=status&show=text
Does not give the status 'up' while is is fine in the prtg api. What could be wrong?
Votes:
This is unfortunately not supported - you'll need to use the metrics option and configure the range to text option to match the configured thresholds. Or use the Down sensors table as described above :)
Kind regards,
Stephan Linke, Tech Support Team
Votes:
Stephan, In my case i want the status raw (3 4 or 5. etc) of a group item. Not a single sensor.
Looks like this is again a limitations of the plugin?
"configure the range to text option to match the configured thresholds Not sure what this is but do you mean value to text mapping?
Votes:
Olson,
Correct, I meant the value to text mapping and yes, it's a limitation of the plugin from what I can tell :/ I'm using the value-to-text mapping to display it on our dashboard accordingly.
Kind regards,
Stephan Linke, Tech Support Team
Votes:
doesnt work with 18.1.37.13946+ . Is there anyone with same issue ?
Votes:
What exact error do you get?
Votes:
Same Problem here. When I try to add the Datasource, save&test, then a red Icon of a warning sign appears, and nothing else happens. I tried with grafan 4 and grafana 5, multiple times and multiple configurations. I also tried with the cloud Grafana. no luck at all.
I tried it with Version 17 and the actual one 18.1.38.11934+ There is no difference...it just, does not want PRTG as DataSource.
regards Thomas
ps: I would not try Grafana, if the MAPS would be usable...just telling...A Monitor on the wall, showing red sensor readable from 5 meters away. Thats all I want.
Votes:
This is the error I get with an up2date installation 18.1.38.11934+, Grafana 5, installed PRTG Addon on a Linux 16.4

Everything above, except PRTG, is just freshly installed in the last 1 hour.
It must be something with my PRTG installation then, if Paessler is able to install/use Grafana without problems. But what? Where can I start looking?
Votes:
Ha...It works! It's alive...I needed to create a dedicated user
http is NOT working, need to use https and SKIP TLS.
cheers Thomas
Votes:
I'm also having an issue with a table showing sensor statuses not refreshing.
Query Mode: Raw URI: table.json Querty String: content=sensors&columns=device,sensor,status,message,downtimesince&filter_status=4&filter_status=5
It displays properly but does not refresh, it only updates if the whole page is reloaded. Everything else on the dashboard refreshes normally.
I see this issue has been reported on the GitHub page but doesn't look like a solution yet. I'm wondering if anyone here has been able to get the table to refresh along with the rest of the data, without reloading the whole page or setting up a playlist?
Votes:
I had kind the same issue with not reloading. I use playlists now..
I also entered 1 in the cache timeout in the data source..I don't really know what it does, but I think it may update the data nly every 5 minutes if you enter a 5 like in the manual above? could that be? Because first I did that and my graphs where not updated.
Votes:
I ended up trying the cache timeout of 1 in the plugin settings, reloaded the page, then set the dashboard refresh to 90 seconds. After several minutes of refreshing, still no update to the table. I'm not sure what is affected by the cache timeout setting.
I also noticed this issue when adding a panel and selecting text as the query mode. The value was displayed but never refreshed until the page was reloaded. If the query mode is using metrics everything seems to refresh as expected, the issue seems to be with text and raw.
Votes:
Im trying to use this plugin with PRTG, i have 6 probes, and a lot of groups/subgroups, this plugins brokes with this configuration..
This is how i doing it:
$continent : group:*
countries: group:group=$continent (this fails, i can not query a group of group.. )
Since i can not get the group countries i can not filter the devices inside this groups, have you done this before?
Votes:
Aaron and Maurizio,
For specific questions regarding the plugin, please check out the issue tracker of the project and create a new issue if necessary, as it may require changes in the code. But he [dev] is rather busy :/
Kind regards,
Stephan Linke, Tech Support Team
Votes:
Hi there, I have just installed this and its working well, but all of my bandwidth usage charts coming into Grafana are off by a factor of 10. A bit unfortunate.. if it were off by a factor of 100, I could work around it by changing between bps or kbps etc.
Has anyone ever seen this issue and/or have any ideas? The bandwidth usage in PRTG itself is correct.
Votes:
Factor 10 seems weird - Could you post the axes configuration and the historic data of the sensor within PRTG from the same timespan?
Kind regards
Stephan Linke, Tech Support Team
Votes:
Sure, see link here for screenshots:
You can see the peak here is 30 MB, but Grafana shows as 3 MB. If I change the Unit to kbps, Grafana then shows as 3 Gbps.
Votes:
I can recreate that but I can't tell who's wrong here - PRTG delivering wrong values or Grafana calculating wrong. Are you using the latest Grafana build?
Votes:
Good to know it's not just me..! Yes, I just downloaded and installed Grafana yesterday. It's version 5.0.3.
Votes:
Is there any further info I can provide to help troubleshoot this? Is there a different way I should be setting this up? Seems pretty unusual that I'd be the first to uncover this as I'd think it is a pretty standard use case.
Votes:
I haven't had the time to analyze this further due to the sheer amount of support cases :/ But seemingly, the development branch of the plugin has a multiplier option:
 .
.
Simply download it, overwrite ./grafana/data/plugins/jasonlashua-prtg-datasource/jasonlashua-prtg-datasource/dist with the dist folder of the zip file, restart grafana and it should be there. Let me know if that solves the issue :)
Votes:
Thanks Stephan.
It is a apparently a known issue I stumbled across while looking for more details on the multiplier, since it did not work for me.
https://github.com/neuralfraud/grafana-prtg/issues/56
Sounds like mixed results -- perhaps the latest build broke it, or I read something about this converting speed vs. volume as well. Still digging into it, but looks like the overall issue is mismatched assumptions. Dev on the plugin side implies that PRTG should support this, but I think that as the core product that the plugin is developed for, this should get changed on that side... I will update here when/if successfully resolved
Votes:
OK, I don't know why, but this multiplier suddenly started working by itself (i'd already restarted Grafana, refreshed browser etc.)
Also, as implied in the thread, I was off in my initial assessment -- these graphs were not off by a factor 10, but rather a factor of 8. Bits vs bytes.
But anyway, case closed! Thanks for bringing the dev build to my attention, Stephan, and hopefully being out here, this info will help others.
Votes:
I am also having problems getting table data to refresh. Using a playlist make all blink and is not a very nice solution.
Votes:
What does the current URL look like?
Votes:
URL: [IP Address]:443/api
line break
Access: Sever (Default)
line break
Skip TLS: Cheked
line break
Cache timeout: 1
Metric queries works fine, and i do get my table populated on the initial Raw query "content=sensors&columns=objid,downtimesince,downtimetime,device,sensor,lastvalue,status,message,priority&filter_status=5&filter_status=13" using the table.json URI. But as others have mentioned in this post and on the github issue tracker for the plugin, the table data does not refresh unless to refresh the page using a playlist. This makes all our TV screens flicker and is not very nice solution. To bad the PRTG maps do not scale well to large screen TV's.
Votes:
Yep, ongoing issue: https://github.com/neuralfraud/grafana-prtg/issues/51 :/ Sorry, not much we can do.
Votes:
Then we need to find an alternative to grafana. As it does not seems the dev will fix it.
Votes:
You could just create multiple maps that show more details and cycle through them. I looked at Graphna as well and while I think it is a great solution, I found it to complicated for what I was looking for.
The PRTG maps are great - but we wanted something that auto-cycles through the maps while giving us a lot of control of the cycling. The internal PRTG cycling - well - besides that I wasn't aware of it - does not give you that much control.
Ended up writing my own front-end HTML page and cycling through any URL I want - not necessarily PRTG - we ended up having some fun with the NOC TV in the IT room while putting some Easter eggs in there - here and there a little Video or a GIF that is just funny... as a matter of fact, you could put an IP cam in the MDF/Server room and put that in between...
The solution allows you to even have the company logo appearing while the current map / link is loaded.. it will fade out and make it a pretty smooth transition..
You can find it in the Paessler KB here https://kb.paessler.com/en/topic/79668-prtg-maps-auto-cycle or on my personal blog here https://www.it-admins.com/auto-cycle-through-urls/ along with a lot of other PRTG solutions as well as a lot more of system administrator stuff that might be helpful..
Of course, I am not sure if this is the solution you are looking for - but I hope this helps!
Regards
Florian Rossmark
Votes:
Hi Florian,
Thanks for chiming in, much appreciated! :)
Kind regards,
Stephan Linke, Tech Support Team
Votes:
Is it possible to divide values? Some SNMP values come "raw", in PRTG I can simply add "divide by 10" in the sensor. However this seems to be in display only, Grafana reads the raw value. Can I add this division in Grafana with the PRTG plugin somehow? 250°C in a datacenter ... nope ... ;)
Votes:
With these days temperatures, those values are not so far off ;) Just kidding. The development branch of the plugin has a divide/multiply field you could use :)
Kind regards,
Stephan Linke, Tech Support Team
Votes:
Stephan, I pasted the following code below in a HTML text panel on our Grafana dashboard, modified the weekday to the current day of the week but the day of the week would still not change colors. Can you confirm if what I have below is indeed correct?
<h3 id='weekdayThursday' style='font-weight:bold; text-align:center'>Thursday</h3>

<script type='text/javascript'>
function refresh() {
 // weekday highlightning
switch((new Date).getDay()){case 0:day="weekdaySunday";break;case 1:day="weekdayMonday";break;case 2:day="weekdayTuesday";break;case 3:day="weekdayWednesday";break;case 4:day="weekdayThursday";break;case 5:day="weekdayFriday";break;case 6:day="weekdaySaturday"}document.getElementById(day).style.color="#b4cc38";
}
</script>
Thank you!
Created on Nov 1, 2018 6:27:33 PM
Last change on Nov 4, 2018 4:11:37 PM by
Stephan Linke [Paessler Support]
Votes:
It's indeed correct, but will only work for Thursday. Make sure to have all weekdays available on the dashboard:
<h3 id='weekdayMonday' style='font-weight:bold; text-align:center'>Monday</h3>
<h3 id='weekdayTuesday' style='font-weight:bold; text-align:center'>Tuesday</h3>
<h3 id='weekdayWednesday' style='font-weight:bold; text-align:center'>Wednesday</h3>
<h3 id='weekdayThursday' style='font-weight:bold; text-align:center'>Thursday</h3>
<h3 id='weekdayFriday' style='font-weight:bold; text-align:center'>Friday</h3>
They should then be colored accordingly depending on the day of week :)
PRTG Scheduler |
PRTGapi |
Feature Requests |
WMI Issues |
SNMP Issues
Kind regards,
Stephan Linke, Tech Support Team
Votes:
So, I created seven individual HTML text plugins, each customized with their own day of the week html code and placed the java script below the HTML text in each panel. This still would not Highlight the current day of the week. This is with Grafana version 5.3.1 if that makes a difference. :(
Votes:
Do you have added the javascript multiple times? You actually only need it once and use different IDs in the various text panels (that represent the day)... :s
PRTG Scheduler |
PRTGapi |
Feature Requests |
WMI Issues |
SNMP Issues
Kind regards,
Stephan Linke, Tech Support Team
Created on Nov 5, 2018 6:43:10 PM by
Stephan Linke [Paessler Support]
Last change on Nov 5, 2018 6:43:17 PM by
Stephan Linke [Paessler Support]
Votes:
I did have the java scripted copied to each panel but I had also tried just creating a separate invisible panel with just the java script and a separate panel with the current day and it still would not execute the function. I found that by adding "document.onload = refresh()" just below "<script type='text/javascript'>", the function executes and highlights the text now. =)
Votes:
Nice one :)
PRTG Scheduler |
PRTGapi |
Feature Requests |
WMI Issues |
SNMP Issues
Kind regards,
Stephan Linke, Tech Support Team
Votes:
I am having an issue. All the channels in Grafana show the same results of only Channel #1. So if I have a sensor with 5 channels, and I add 3 of them to Grafana, they all return the result of Channel #1.
Votes:
The plugin is unfortunately discontinued, so it's possible that it's not working correctly anymore (as stated in the initial post). Sorry, it's pretty much dead :/ You might want to post on the github project (in the issues section, perhaps one of the users is able to help?
PRTGapi |
Feature Requests |
WMI Issues |
SNMP Issues
Kind regards,
Stephan Linke, Tech Support Team
Votes:
The ability to quickly combine the power of PRTG and Grafana would solve the maps issues (they're quite limited as to what can be done) in PRTG, please upvote https://kb.paessler.com/en/topic/83907-integration-datasource-for-grafana & https://kb.paessler.com/en/topic/85737-open-native-grafana-plugin.
As for the PRTG team, this would really push PRTG as the go to tool for various other users.
Votes:
We are looking at the possibility of creating a new map designer, that should be easier to use, and provide more flexibility. As this is still in the opening stages of development, we do not have a date yet as to when the new map designer will be available.
Kind regards,
Sasa Ignjatovic, Tech Support Team
Votes:
Guys! Please! PRTG is really miss for a new functions in Map Designer! Modern IT is a non-stop changes area, for example we have about 30 people who use PRTG maps every day, it's very hard to manage maps changes with so many peaple and so many departments (help desk, development, infrastructure).
Votes:
As my colleague already mentioned: We are aware already, that the map designer should be redesigned. That's why we are looking at the possibility of creating a new map designer, that should be easier to use, and provide more flexibility. You'll find it already on our Roadmap
Kind Regards,
Timo Dambach
Paessler Tech Support
Votes:
Personally, while I see the value in creating the new map designer, I would prefer a native solution to hook into Grafana. As you mentioned in the suggested solution, the value in Grafana is that you can pull from multiple sources (for example, I have dashboards pulling metrics from PRTG and logs from Elasticsearch). I have been doing my best to work around the limitations of the existing plugin, but it is quite frustrating (and of course, this is no fault of yours!)
I have tried on multiple occasions to patch the existing plugin, but my javascript / XSLT skillset is simply not that good. I am hoping that the proposed new REST API though may make development of such a plugin a little bit easier.
Votes:
Hi All can any one send me the Json file of a PRTG grafana dashboard
©2025 Paessler AG Terms & Conditions Privacy Policy Legal Notice Download & Install
Add comment