hi, i love PRTG (been using paessler sw since IPcheck!).
one feature ive always wanted to see added to prtg is the ability to add a note to a point in time on a sensor's graph (or even a vertical line + note to the graph) - example, a dot/line at 9/23/2018 4:15pm = "Upgraded all wifi Radios"
or even add a note to the point in time only on the sensors table (of values , if placing on graphs is a complicated feature to add).
Very much like how one can tag a note to their charts in "Google Analytics" (web analytics).
We supply internet to many apartments and hotels, and often when we make changes to improve performance it would be helpful to add a mark / note to the graphs, so that we can watch/compare for changes in the sensor data (or to be able to go back a few months time and see that note and look for trends in the graphs based upon that note).
often the effects of changes may not be apparent in a bandwidth graph for a week or more, thus it would be great to be able to see a note or line on a graph notating exactly the time/info of our change.
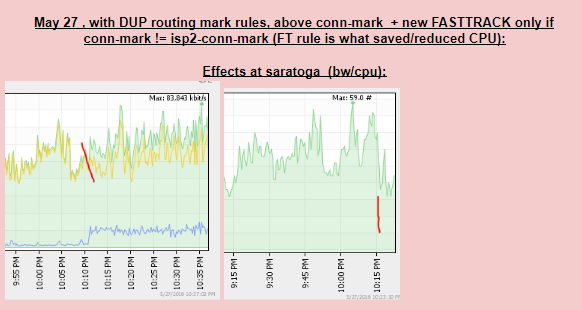
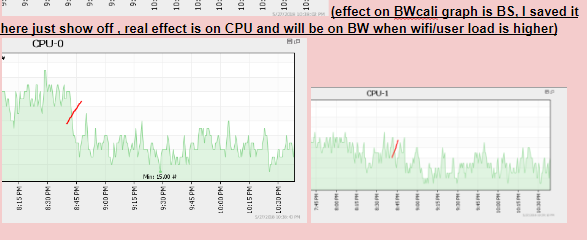
currently we have to keep lists / tables of change notes in google docs, and take screen shots of our PRTG graphs and add graphics, below is one such example. (it would be great if i could have added these text notes to a point or line attached to a prtg sensor's graph):
(all of these examples below, i would have loved to be able to save them as a note or point on the sensors graph, so that we could refer to them in the future or use them as points in time to run comparisons)
Or even just a note to the tables data (ie if it woudl be difficult to integrate this into the graph generator code)
thanks!
examples/how we currently work around this:


Add comment