What is this?

This knowledgebase contains questions and answers about PRTG Network Monitor and network monitoring in general.

Learn more

PRTG Network Monitor

Intuitive to Use. Easy to manage.
More than 500,000 users rely on Paessler PRTG every day. Find out how you can reduce cost, increase QoS and ease planning, as well.

Free Download

Top Tags


View all Tags

Help monitoring Meraki network

Votes:

1

Hi I want to monitor our Meraki network using PRTG.

I have downloaded the mib file from Meraki and imported it to PRTG. Using this in a SNMP library sensor I get sensors set up for access points, SSIDs and lots of sensors that are related to the access points and SSIDs like their status, is a the access point a gateway etc.

Unfortunately I can't tell which of theses sensors for status, gateway etc are related to which access point. Is there a way I can create sensors with multiple channels to group these related sensors together, and that would discover the access points in the network rather like the Cisco snap VPN sensor?

custom devicetemplate meraki paetemplate snmp

Created on Mar 2, 2014 8:46:56 PM

Last change on Aug 10, 2017 8:23:54 AM by  Luciano Lingnau [Paessler]


Best Answer

Accepted Answer

Votes:

3

This article applies to PRTG Network Monitor 16.2.25 or later


Monitoring Meraki with PRTG

There are two very distinct ways of querying Meraki devices, they can either be monitored via the cloud(dashboard) or directly (using the individual AP IP addresses). The information available using each method is distinct.

Meraki has an excellent SNMP Overview and Configuration article available at their website.

Preparation / Meraki Set-up

1) "Cloud" DashBoard (For monitoring AP's status)

Configuration steps as provided by Meraki:

The Dashboard can be configured for SNMP polling from Organization > Settings > SNMP. Once SNMP has been enabled you will be able to send the SNMP requests to the host that is defined directly under the enable setting. It also defines the community string and provides a sample command to extract information via SNMP requests.

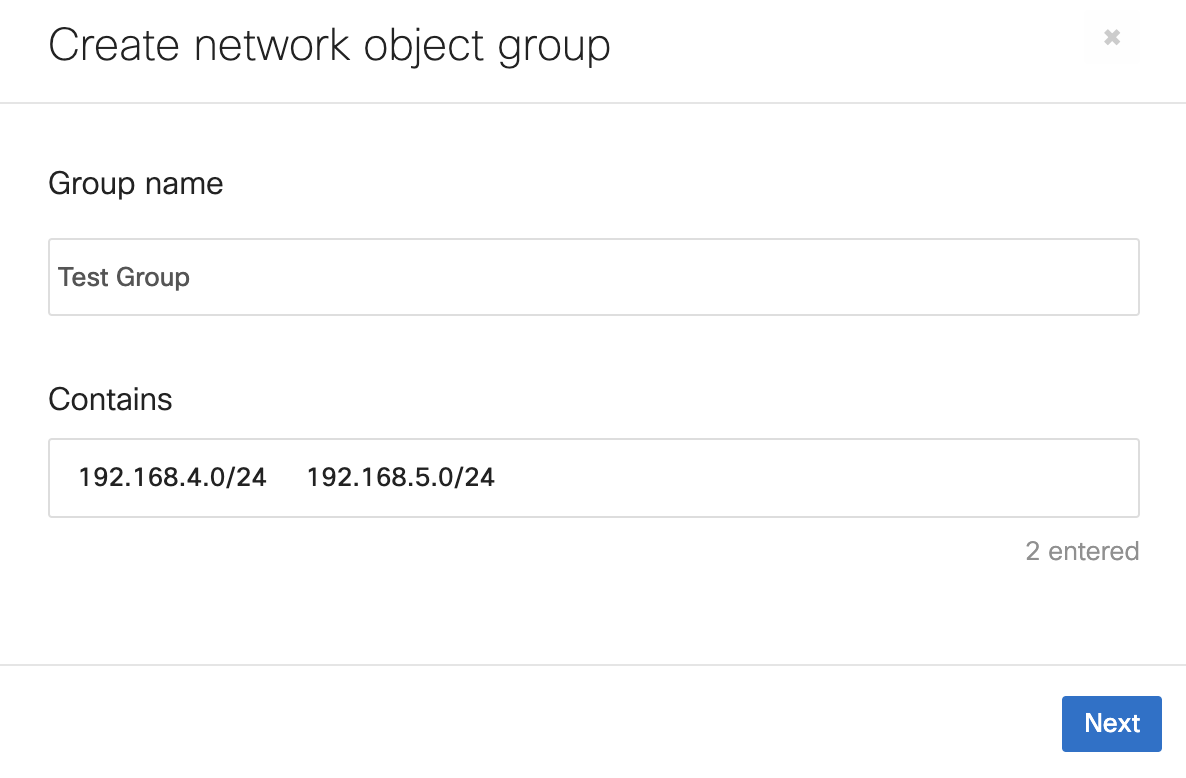
Image

Once enabled note the required SNMP host and Credentials, for example:

Host(The device's address within PRTG)n7.meraki.com
SNMP Communityhasd6dsa
Port16100

2) Enabling direct/local device Polling (For Device's traffic Counters)

Configuration steps as provided by Meraki:

In this scenario the SNMP traffic would stay within the local network and each device would need to be polled from the network management system. These settings can be found under Network-wide > General > Reporting:

Image2

Using SNMP to directly poll individual devices provides the ability to choose between SNMP v1/v2c or v3. You will not be able to poll repeaters using SNMP as they do not have an IP address on the Local LAN
By default, Meraki devices cannot be polled from outside the network. However, after setting up the community string, an MX can be configured to allow polling from a remote IP whitelist, configured under Security appliance > Configure > Firewall & traffic shaping.

For further details:

http://blog.danielpark.com.au/2013/03/29/meraki-mib-cheat-sheet/
https://documentation.meraki.com/zGeneral_Administration/Monitoring_and_Reporting/SNMP_Overview_and_Configuration
https://kb.paessler.com/en/topic/59986-help-monitoring-meraki-network#reply-200811
PRTG Setup

The built-in SNMP Traffic Sensor should also work but doesn't as Meraki's SNMP agent implementation does not respond to uptime queries. While PRTG doesn't offer any alternative built-in sensor for Meraki's devices our Custom Sensors or this device template allows you to monitor your AP's Status and traffic counters. Continue reading for instructions.

This device template can be used to automate the deployment of these sensors using auto-discovery. This template contains two distinct sensors:

Meraki AP

When monitoring the controller (with the correct SNMP Credentials) it's possible to discover and monitor the status of each connected AP.

Interfaces

When using SNMP v2c and querying any Meraki device (AP, Switch, Firewall, etc) this will produce custom traffic sensors via the counters from the ifXTable.

Requirements

  • Since the Device Template relies on the auto-discovery process, the device you want to monitor needs to be reachable via ping.
  • This template will only work to monitor systems which are configured correctly (SNMP Working and responding to OID's from the meraki-cloud-controller-mib and IF-MIB). The following OID need to be 'walkable' via SNMP or your sensors won't be created.
  • 1.3.6.1.2.1.31.1.1 (ifXTable)
  • 1.3.6.1.4.1.29671.1.1.4 (devTable)
  • It's possible to troubleshoot the auto-discovery by inspecting the auto-discovery log, if you get entries like the one below ( NOT FOUND) it means that the required OID's aren't available.
[...]
20.06.2016 14:46:45: Template Check; Device ID: 19294; Check ID: ping; FOUND
20.06.2016 14:46:46: Template Check; Device ID: 19294; Check ID: snmp_system; FOUND
20.06.2016 14:46:47: Template Check; Device ID: 19294; Check ID: snmp_devTable; NOT FOUND
20.06.2016 14:46:49: Template Check; Device ID: 19294; Check ID: snmp_ifXTable; FOUND
[...]

Usage Instructions

You may download the required files here. Relevant files in this archive:

devicetemplates\Custom Meraki.odt 					-> Device Template
lookups\custom\oid.meraki-cloud-controller-mib.dev.devstatus.ovl	-> Lookup File
  1. Extract the Zip Archive to PRTG's Program directory, by default "C:\Program Files (x86)\PRTG Network Monitor\". (The README file can be deleted/skipped)
  2. Head to PRTG's Web-interface, navigate to Setup > Administrative Tools and perform a "Load Lookups" operation.
  3. Create a new device in PRTG with the Address(IP or FQDN) of the equipment that you want to monitor, configure the SNMP Credentials accordingly.
  4. Right click on the device, select "Run Auto Discovery With Template", select the 'Custom Meraki' from the list.

Channel limits or lookups may need to be adjusted to your needs.

Result

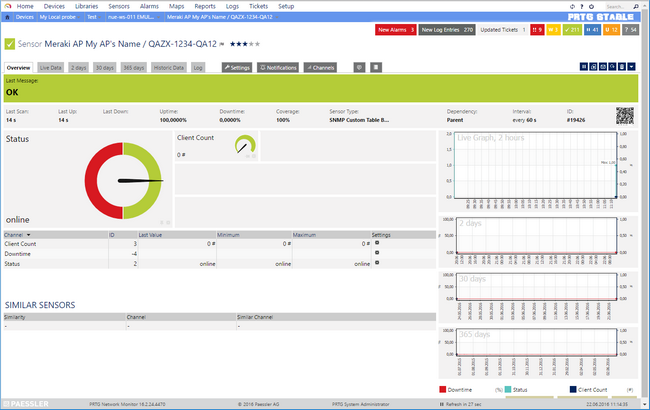
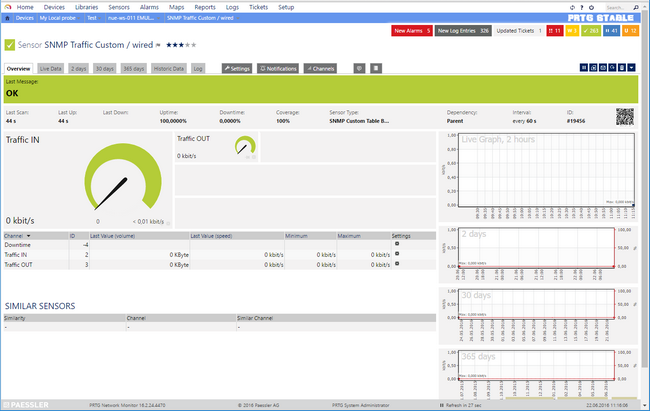
The resulting sensors will look like the following:

AP's Status (via Controller)

Sensor's Overview

Click for full-screen view

Traffic (from Device)

Sensor's Overview

Click for full-screen view

SNMP Data

If you need to validate the SNMP Data Provided by the device/controller you can review the SNMP data directly from your device. To do so, save the text below (in the white box) as .txt and use it with the Scan Script option in our SNMP Tester. This will allow you to review which SNMP queries succeed and which do not deliver any data. Please have this information at hand when contacting our support team.

--------
Walk Script - Cisco Meraki Cloud Controller (https://kb.paessler.com/en/topic/59986)
Version: 0.2
--------
hrSystemUptime
walk=1.3.6.1.2.1.25.1.1
--------
MIB-2 System
walk=1.3.6.1.2.1.1
--------
Sensor Specific Queries
----
ifXTable
walk=1.3.6.1.2.1.31.1.1
----
devTable
walk=1.3.6.1.4.1.29671.1.1.4
----

Changelog

0.12016/06Initial release
0.22017/01Switched from meta=snmp to meta="snmpnext" with a custom OID for increased compatibility.


Notes:

Best Regards,

Created on Jun 20, 2016 12:47:43 PM by  Luciano Lingnau [Paessler]

Last change on Jul 26, 2021 12:11:40 PM by  Maike Guba [Paessler Support] (2,404) 2 1


36 Replies

Votes:

1

Hello,

thank you very much for your KB-Post. I'm afraid it might be best to consult with the vendor of the devices, to see which counters may refer to which AP. Or if there may be a way to use the counters per AP. Native support for Meraki devices is currently not planned, sorry.

best regards.

Created on Mar 3, 2014 3:30:13 PM by  Torsten Lindner [Paessler Support]


Votes:

0

Please consider adding Meraki support.

Created on Apr 24, 2014 4:24:10 PM


Votes:

0

Hi, I have tried using the SNMP traffic sensor to monitor an AP directly. The interfaces of the AP are listed as I setup the sensor, I select them and continue, but then the monitoring shows the error 'no such name'. As the interfaces were detected during the setup of the sensor I am guessing that the AP was queried to get the interfaces so the connection to it over SNMP is OK. Any ideas why I would then get the 'no such name ' error showing immediately?

Created on Apr 24, 2014 8:44:46 PM


Votes:

0

Can you please upload us a screenshot showing the "Settings"-Tab of such a SNMP Traffic Sensor here with this error? Thank you.

Created on Apr 25, 2014 7:40:56 AM by  Torsten Lindner [Paessler Support]


Votes:

0

Hi Torsten, will do. I have probably missed the obvious instructions but how do I upload a screenshot?

Thanks Joseff

Created on Apr 25, 2014 3:29:51 PM


Votes:

0

I'm afraid image uploading is not directly possible in our KB. Please use any image - sharing service, upload the screenshots, and then link them here. Thank you.

Created on Apr 28, 2014 8:17:53 AM by  Torsten Lindner [Paessler Support]


Votes:

1

Hi,

I have just been thru this process, and the issue is that Meraki do not support the sysUpTime OID (1.3.6.1.2.1.1.3.0), which causes the sensors to fail.

My last response, as of April 2014, is that they do not support this and have no plans to add it to their implementation of SNMP on the devices. Which given its a mandatory part of the SNMP specification, is really rather poor......and i'm actually going to return over 100k of hardware because of this, if they don't fix it.

Created on May 27, 2014 11:16:41 PM


Votes:

0

Hello,

I have the same issue 'no such name ' error with SNMP sensors. Did anyone solve this issue or found a workaround?

Created on Nov 11, 2014 3:11:09 PM


Votes:

8

Yes!!!! There is hope for all you Meraki fans. Here's the key:
There are two ways to monitor Meraki devices (see Meraki's article).

Via Dashboard in the Cloud

You set this up in the Organization->Settings->SNMP and it gives you a specific server (n34.meraki.com or similar and NOT the device IP address) and the community RO string that they'll also provide you.

Advantage

You do not need to open any ports to the device which is useful if you are behind a firewall.

Disadvantage

You MUST use the Meraki MIB and only have the sensors that appear (no traffic monitoring)

Directly to the device via SNMP

You set this up in Configure->Alerts & Administration and it allows you to choose the SNMP version and set your community string. In this case you MUST open port UDP 161 directly to the device so you can poll it via SNMP but you have all the parameters of the standard SNMP MIB (check the table that appears in the above link).
So the device IP that you enter is your Meraki IP address. In this case you set up the sensor as Custom SNMP and enter the MIB you wish to monitor directly. For example, to monitor WAN1 traffic I create a custom SNMP sensor, input MIB 1.3.6.1.2.1.31.1.1.1.6.1 (according the the table in the article above), set up as a Delta, set units to Mbits and divide by 120,000 in order to get Mbps.

Both

So, in my case I use both and set up two different devices for each customer. The dashboard MIB allows me to get the number of users connected in my customers network which is really useful and the standard device SNMP MIB allows me to monitor bandwidth on both WAN and LAN interfaces.

I wish I could upload some screenshots to this thread because the graphs are soooooo cool.

Hope this helps and I`m happy to help anybody out.

Cheers,
Andres
Fastweb-simple solutions for complex networks

Created on Nov 26, 2014 3:34:16 PM

Last change on Jun 2, 2015 6:51:48 AM by  Luciano Lingnau [Paessler]


Votes:

0

Your best bet if you want to monitor Meraki devices with SNMP is to download IF-MIB, then use the MIB importer to import the MIB and save OID into your PRTG snmplibs folder. Then create your SNMP Library sensor using the IF-MIB.

It's much faster than looking up the OIDs yourself. You can monitor pretty much any counters you want. In/out octets and in/out discards, plus any other counters you want and multiply/divide to your preference. x8 for bps, x.125 for kbps, etc.

Created on Dec 25, 2015 10:22:20 PM


Votes:

1

While PRTG doesn't offer built-in sensor for Meraki's devices our Custom Sensors can monitor most of the available information.

The built-in SNMP Traffic Sensor should also work but doesn't as Meraki's SNMP agent implementation does not respond to uptime queries.


There are two very distinct ways of querying Meraki devices, they can either be monitored via the cloud(dashboard) or directly (using the individual AP IP addresses). The information available using each method is distinct.

Meraki has an excellent SNMP Overview and Configuration article available at their website.

Option 1 - Monitor the Dashboard 'cloud'

Setup - Dashboard

Configuration steps as provided by Meraki:

The Dashboard can be configured for SNMP polling from Organization > Settings > SNMP. Once SNMP has been enabled you will be able to send the SNMP requests to the host that is defined directly under the enable setting. It also defines the community string and provides a sample command to extract information via SNMP requests.

Image

Once enabled you'll be provided the required SNMP host and Credentials, for example:

Host(The device's address within PRTG)n7.meraki.com
SNMP Communityhasd6dsa
Port16100

Setup - PRTG

From there you can also download the MERAKI-CLOUD-CONTROLLER-MIB which will be useful later. Download the MIB file and copy it into "C:\Program Files (x86)\PRTG Network Monitor\MIB\".

You're also required to create a lookup file for the Device's State definition, please copy/paste the text below into an text file and save it as prtg.customlookups.meraki.devstatus.ovl under C:\Program Files (x86)\PRTG Network Monitor\lookups\custom\

<?xml version="1.0" encoding="UTF-8"?>
  <ValueLookup id="prtg.customlookups.meraki.devstatus" desiredValue="1" xmlns:xsi="http://www.w3.org/2001/XMLSchema-instance" xsi:noNamespaceSchemaLocation="PaeValueLookup.xsd">
    <Lookups>
      <SingleInt state="Ok" value="1">Online</SingleInt>
      <SingleInt state="Error" value="0">Offline</SingleInt>
    </Lookups>
  </ValueLookup>

Restart PRTG's Core Server afterwards.

Creating sensors within PRTG

Once you've created a new device with the provided Address for SNMP Queries (e.g.: n7.meraki.com), configure it's SNMP Credentials (Version, Community and port) accordingly. Once the credentials are configured, add a new Sensor and search for the SNMP Custom Table Sensor.

During it's creation the Sensor will ask for the Table's OID, please enter 1.3.6.1.4.1.29671.1.1.4. PRTG will then render a table and display all information available on your controller (within the Dashboard's SNMP devTable). You'll have to use the top check-box to select all available access points. Additionally, please configure the following:

Sensor NameMeraki AP [rowidentifier]
Identification ColumndevName
Sensor Channel #1 NameState
Sensor Channel #1 ColumndevStatus
Sensor Channel #1 UnitValue Lookup
Sensor Channel #1 Value Lookupprtg.customlookups.meraki.devstatus
Sensor Channel #2Enabled
Sensor Channel #2 NameConnected Clients
Sensor Channel #2 ColumndevClientCount
Sensor Channel #2 UnitCount

Press Continue, and PRTG will deploy a sensor for each available AP(Device), the primary channel (State) will tell you whenever the AP is connected or disconnected, when disconnected the sensor will go down. The secondary channel (Connected Clients) will display and graph the amount of clients connected to this Access Point.

Option 2 - Local device polling

Setup - Dashboard

Configuration steps as provided by Meraki:

In this scenario the SNMP traffic would stay within the local network and each device would need to be polled from the network management system. These settings can be found under Network-wide > General > Reporting:

Image2

Using SNMP to directly poll individual devices provides the ability to choose between SNMP v1/v2c or v3. You will not be able to poll repeaters using SNMP as they do not have an IP address on the Local LAN
By default, Meraki devices cannot be polled from outside the network. However, after setting up the community string, an MX can be configured to allow polling from a remote IP whitelist, configured under Security appliance > Configure > Firewall & traffic shaping.

Setup - PRTG

Within PRTG you'll need to make sure that you can reach each individual AP by It's IP Address, then create a new device for each AP you want to monitor directly, you'll also have to configure the SNMP Credentials accordingly.

Creating sensors within PRTG

For each device that you've created within PRTG, add a new sensor, search for the SNMP Custom Table Sensor.

During it's creation the Sensor will ask for the Table's OID, please enter 1.3.6.1.2.1.31.1.1. PRTG will then render a table and display the available information contained in the SNMP Interfaces Table of the polled device. The available interfaces will be wired0, wifi0 and wifi1.

Select the desired interfaces from the list and configure the following:

Sensor NameSNMP Traffic [rowidentifier]
Identification ColumnifName
Sensor Channel #1 NameTraffic IN
Sensor Channel #1 ColumnifHCInOctets
Sensor Channel #1 Value TypeDelta (Counter)
Sensor Channel #1 UnitBytesBandwidth
Sensor Channel #2 NameTraffic OUT
Sensor Channel #2 ColumnifHCOutOctets
Sensor Channel #2 Value TypeDelta (Counter)
Sensor Channel #3 UnitBytesBandwidth

Press Continue, and PRTG will deploy a Traffic Sensor for each selected interface, please note that the sensor will not support the same features as the standard SNMP Traffic Sensor but it should work as a workaround.

For further details:

http://blog.danielpark.com.au/2013/03/29/meraki-mib-cheat-sheet/
https://documentation.meraki.com/zGeneral_Administration/Monitoring_and_Reporting/SNMP_Overview_and_Configuration
https://kb.paessler.com/en/topic/59986-help-monitoring-meraki-network#reply-200811
Created on Feb 2, 2016 11:58:53 AM by  Luciano Lingnau [Paessler]

Last change on Feb 3, 2016 7:55:46 AM by  Luciano Lingnau [Paessler]


Votes:

0

I attempted the above with poor results. First tried the mentioned OID 1.3.6.1.2.1.31.1.1. But this seems to only have values and report data sporadically. I also tried another OID table (ifTable), 1.3.6.1.2.1.2.2. With better but similar results.

Paessler, can you please add full support for Meraki devices? This has been a frustrating exercise in MIB walking.

Created on Apr 16, 2016 6:20:31 PM


Votes:

0

Hello Ryan Egan,
thank you for your post.

Please note that our standard "SNMP Traffic" sensors use data from 1.3.6.1.2.1.31.1.1 and 1.3.6.1.2.1.2.2, if you experience issues with the Custom Table sensor with these tables the results with the built-in sensor would be exactly the same. The SNMP Counters needs to be reliable and constantly available for your monitoring to work properly.

Please make sure to have configured/using at least SNMP V2c for best results. If counters are only delivering data "sporadically" kindly contact Meraki.

Best Regards,

Created on Apr 18, 2016 12:11:27 PM by  Luciano Lingnau [Paessler]


Votes:

0

Hello Luciano Lingnau,

I tried to follow your guide to add the Meraki Dashboard to PRTG but having an issue. I copied the MIB from Meraki to the correct folder on my server and also the lookup file, but when I get to the step to specify the lookup file in PRTG it doesn't show in the dropdown menu. This is the option I'm having problems with seeing: Sensor Channel #1 Value Lookup - prtg.customlookups.meraki.devstatus

PRTG is able to see all the my devices from the Meraki Dashboard fine and I've restarted PRTG Core Server and even the entire server but I can't see any of the lookup values from the custom device state definition file. I'm using the current version of PRTG if that helps.

Thanks!

Created on Jun 2, 2016 2:58:25 PM

Last change on Jun 3, 2016 7:38:43 AM by  Luciano Lingnau [Paessler]


Votes:

0

Hello Blake,
thank you for your post.

Please double check that the syntax of the prtg.customlookups.meraki.devstatus.ovl file is correct (XML) and that it was saved under C:\Program Files (x86)\PRTG Network Monitor\lookups\custom\.

The files should be loaded by PRTG after a restart of the core server service(Or re-load lookups option from Setup > Administrative Tools), if not please check whenever PRTG created a new ticket "Error loading value lookup file" which it will do when PRTG is unable to load any of the present lookups.

Best Regards,

Created on Jun 3, 2016 7:42:02 AM by  Luciano Lingnau [Paessler]


Accepted Answer

Votes:

3

This article applies to PRTG Network Monitor 16.2.25 or later


Monitoring Meraki with PRTG

There are two very distinct ways of querying Meraki devices, they can either be monitored via the cloud(dashboard) or directly (using the individual AP IP addresses). The information available using each method is distinct.

Meraki has an excellent SNMP Overview and Configuration article available at their website.

Preparation / Meraki Set-up

1) "Cloud" DashBoard (For monitoring AP's status)

Configuration steps as provided by Meraki:

The Dashboard can be configured for SNMP polling from Organization > Settings > SNMP. Once SNMP has been enabled you will be able to send the SNMP requests to the host that is defined directly under the enable setting. It also defines the community string and provides a sample command to extract information via SNMP requests.

Image

Once enabled note the required SNMP host and Credentials, for example:

Host(The device's address within PRTG)n7.meraki.com
SNMP Communityhasd6dsa
Port16100

2) Enabling direct/local device Polling (For Device's traffic Counters)

Configuration steps as provided by Meraki:

In this scenario the SNMP traffic would stay within the local network and each device would need to be polled from the network management system. These settings can be found under Network-wide > General > Reporting:

Image2

Using SNMP to directly poll individual devices provides the ability to choose between SNMP v1/v2c or v3. You will not be able to poll repeaters using SNMP as they do not have an IP address on the Local LAN
By default, Meraki devices cannot be polled from outside the network. However, after setting up the community string, an MX can be configured to allow polling from a remote IP whitelist, configured under Security appliance > Configure > Firewall & traffic shaping.

For further details:

http://blog.danielpark.com.au/2013/03/29/meraki-mib-cheat-sheet/
https://documentation.meraki.com/zGeneral_Administration/Monitoring_and_Reporting/SNMP_Overview_and_Configuration
https://kb.paessler.com/en/topic/59986-help-monitoring-meraki-network#reply-200811
PRTG Setup

The built-in SNMP Traffic Sensor should also work but doesn't as Meraki's SNMP agent implementation does not respond to uptime queries. While PRTG doesn't offer any alternative built-in sensor for Meraki's devices our Custom Sensors or this device template allows you to monitor your AP's Status and traffic counters. Continue reading for instructions.

This device template can be used to automate the deployment of these sensors using auto-discovery. This template contains two distinct sensors:

Meraki AP

When monitoring the controller (with the correct SNMP Credentials) it's possible to discover and monitor the status of each connected AP.

Interfaces

When using SNMP v2c and querying any Meraki device (AP, Switch, Firewall, etc) this will produce custom traffic sensors via the counters from the ifXTable.

Requirements

  • Since the Device Template relies on the auto-discovery process, the device you want to monitor needs to be reachable via ping.
  • This template will only work to monitor systems which are configured correctly (SNMP Working and responding to OID's from the meraki-cloud-controller-mib and IF-MIB). The following OID need to be 'walkable' via SNMP or your sensors won't be created.
  • 1.3.6.1.2.1.31.1.1 (ifXTable)
  • 1.3.6.1.4.1.29671.1.1.4 (devTable)
  • It's possible to troubleshoot the auto-discovery by inspecting the auto-discovery log, if you get entries like the one below ( NOT FOUND) it means that the required OID's aren't available.
[...]
20.06.2016 14:46:45: Template Check; Device ID: 19294; Check ID: ping; FOUND
20.06.2016 14:46:46: Template Check; Device ID: 19294; Check ID: snmp_system; FOUND
20.06.2016 14:46:47: Template Check; Device ID: 19294; Check ID: snmp_devTable; NOT FOUND
20.06.2016 14:46:49: Template Check; Device ID: 19294; Check ID: snmp_ifXTable; FOUND
[...]

Usage Instructions

You may download the required files here. Relevant files in this archive:

devicetemplates\Custom Meraki.odt 					-> Device Template
lookups\custom\oid.meraki-cloud-controller-mib.dev.devstatus.ovl	-> Lookup File
  1. Extract the Zip Archive to PRTG's Program directory, by default "C:\Program Files (x86)\PRTG Network Monitor\". (The README file can be deleted/skipped)
  2. Head to PRTG's Web-interface, navigate to Setup > Administrative Tools and perform a "Load Lookups" operation.
  3. Create a new device in PRTG with the Address(IP or FQDN) of the equipment that you want to monitor, configure the SNMP Credentials accordingly.
  4. Right click on the device, select "Run Auto Discovery With Template", select the 'Custom Meraki' from the list.

Channel limits or lookups may need to be adjusted to your needs.

Result

The resulting sensors will look like the following:

AP's Status (via Controller)

Sensor's Overview

Click for full-screen view

Traffic (from Device)

Sensor's Overview

Click for full-screen view

SNMP Data

If you need to validate the SNMP Data Provided by the device/controller you can review the SNMP data directly from your device. To do so, save the text below (in the white box) as .txt and use it with the Scan Script option in our SNMP Tester. This will allow you to review which SNMP queries succeed and which do not deliver any data. Please have this information at hand when contacting our support team.

--------
Walk Script - Cisco Meraki Cloud Controller (https://kb.paessler.com/en/topic/59986)
Version: 0.2
--------
hrSystemUptime
walk=1.3.6.1.2.1.25.1.1
--------
MIB-2 System
walk=1.3.6.1.2.1.1
--------
Sensor Specific Queries
----
ifXTable
walk=1.3.6.1.2.1.31.1.1
----
devTable
walk=1.3.6.1.4.1.29671.1.1.4
----

Changelog

0.12016/06Initial release
0.22017/01Switched from meta=snmp to meta="snmpnext" with a custom OID for increased compatibility.


Notes:

Best Regards,

Created on Jun 20, 2016 12:47:43 PM by  Luciano Lingnau [Paessler]

Last change on Jul 26, 2021 12:11:40 PM by  Maike Guba [Paessler Support] (2,404) 2 1


Votes:

0

Compatibility with versions prior to 16.2.25

This template will cause the following error in older PRTG Versions:

Could not find a table row matching the index you specified when adding the sensor (xxxx). The value of the column you selected might have changed. (code: PE247)

To workaround the issue, download and copy the meraki-cloud-controller-mib.MIB to C:\Program Files (x86)\PRTG Network Monitor\MIB on your core server and restart the Core Server before performing the auto-discovery.

Created on Jun 22, 2016 11:03:37 AM by  Luciano Lingnau [Paessler]


Votes:

0

I love the work that has gone into finding a way to monitor Meraki devices. Thank you!

I am attempting to monitor Meraki MX security appliances. I've found that using the template provided by Luciano does show up but upon running auto-discovery with the new template, results in auto-discovery completing very quickly without any sensors.

I checked the Auto Discovery Debug Log and find:

12/6/2016 12:20:39 PM: Device Templates; Device ID: 6282; Selected: 1
12/6/2016 12:20:39 PM: Template Loaded; Device ID: 6282; Name: Custom Meraki
12/6/2016 12:20:40 PM: Template Check; Device ID: 6282; Check ID: ping; FOUND
12/6/2016 12:20:41 PM: Template Check; Device ID: 6282; Check ID: snmp; ERROR: 106

I added my own computer's IP to the MX allowed SNMP hosts and ran the Paessler SNMP Tester, and found that I am able to do an SNMP walk against 1.3.6.1.2.1.31.1.1 (ifXTable) but am NOT able to walk 1.3.6.1.4.1.29671.1.1.4 (devTable) for I get the following:

----------------------- New Test -----------------------
Paessler SNMP Tester 5.1
12/6/2016 12:46:33 PM (7 ms) : Device: 192.168.95.1
12/6/2016 12:46:33 PM (11 ms) : SNMP V2c
12/6/2016 12:46:33 PM (15 ms) : Walk 1.3.6.1.4.1.29671.1.1.4
12/6/2016 12:46:33 PM (26 ms) : Error: 224

I haven't been able to dig up much on this so far. Does anyone have any ideas how I can continue to troubleshoot this?

Thanks!

Created on Dec 6, 2016 6:47:11 PM

Last change on Dec 7, 2016 9:48:35 AM by  Luciano Lingnau [Paessler]


Votes:

0

Hi there dsavlin,

thank you for your feedback. Based on your log:

12/6/2016 12:20:41 PM: Template Check; Device ID: 6282; Check ID: snmp; ERROR: 106

PRTG checked for SNMP connectivity and it failed, it then halted the auto-discovery.

However, this result is normal/expected, since this OID is for the access points status and does most likely not exist on your MX appliance:

12/6/2016 12:46:33 PM (15 ms) : Walk 1.3.6.1.4.1.29671.1.1.4
12/6/2016 12:46:33 PM (26 ms) : Error: 224

Now, for me to understand why your auto-discovery failed, I'll need you to perform the following:

  1. . Copy/paste the content of the code block below into a txt file and save it to your disk.
  2. . On the PRTG Server, run the SNMP Tester again, but this time use the "Scan Script" test (instead of walk) and load the file that you've previously saved to disk.
--------
Interfaces Table Query
--------
System SNMP MIB-2 System
walk=1.3.6.1.2.1.1
--------
----
ifTable(32bit)
walk=1.3.6.1.2.1.2.2
----
ifXTable(64bit)
walk=1.3.6.1.2.1.31.1.1
----

Please contact us via a support ticket and mention this KB-Post, we'll need the TXT log from the SNMP Tester to tell us more about what happened. You won't be able to add the attachment when opening the ticket, but as soon as you receive an confirmation e-mail regarding the ticket (with a case number PAEXXXXX), reply to that e-mail and forward us any attachments.

Best Regards,
Luciano Lingnau [Paessler Support]

Created on Dec 8, 2016 8:37:52 AM by  Luciano Lingnau [Paessler]


Votes:

0

Thanks for the great write up. Unfortunately I haven't been about to get it to work for our MX64. This is what I am getting in the auto discovery log:

6/01/2017 11:15:47 AM: Template Loaded; Device ID: 2392; Name: Custom Meraki
6/01/2017 11:15:52 AM: Template Check; Device ID: 2392; Check ID: ping; FOUND
6/01/2017 11:15:53 AM: Template Check; Device ID: 2392; Check ID: snmp; ERROR: 106

That sounds like SNMP is not working but I can use the Paessler SNMP Tester to walk 1.3.6.1.2.1.31.1.1 (ifXTable). This is what I get:

Paessler SNMP Tester 5.2.3 Computername: PC Interface: (192.168.1.2)
6/01/2017 11:33:19 AM (11 ms) : Device: 192.168.1.1
6/01/2017 11:33:19 AM (16 ms) : SNMP V2c
6/01/2017 11:33:19 AM (21 ms) : Walk 1.3.6.1.2.1.31.1.1
6/01/2017 11:33:19 AM (27 ms) : 1.3.6.1.2.1.31.1.1.1.1.1 = "wan1" [ASN_OCTET_STR]
6/01/2017 11:33:19 AM (33 ms) : 1.3.6.1.2.1.31.1.1.1.1.2 = "lan1" [ASN_OCTET_STR]
6/01/2017 11:33:19 AM (39 ms) : 1.3.6.1.2.1.31.1.1.1.1.3 = "lan2" [ASN_OCTET_STR]
6/01/2017 11:33:19 AM (44 ms) : 1.3.6.1.2.1.31.1.1.1.1.4 = "lan3" [ASN_OCTET_STR]
6/01/2017 11:33:19 AM (50 ms) : 1.3.6.1.2.1.31.1.1.1.1.5 = "lan4" [ASN_OCTET_STR]
6/01/2017 11:33:19 AM (55 ms) : 1.3.6.1.2.1.31.1.1.1.2.1 = "0" [ASN_COUNTER]
6/01/2017 11:33:19 AM (61 ms) : 1.3.6.1.2.1.31.1.1.1.2.2 = "0" [ASN_COUNTER]
6/01/2017 11:33:19 AM (67 ms) : 1.3.6.1.2.1.31.1.1.1.2.3 = "0" [ASN_COUNTER]
6/01/2017 11:33:19 AM (72 ms) : 1.3.6.1.2.1.31.1.1.1.2.4 = "0" [ASN_COUNTER]
6/01/2017 11:33:19 AM (78 ms) : 1.3.6.1.2.1.31.1.1.1.2.5 = "0" [ASN_COUNTER]
6/01/2017 11:33:19 AM (83 ms) : 1.3.6.1.2.1.31.1.1.1.3.1 = "0" [ASN_COUNTER]
6/01/2017 11:33:19 AM (89 ms) : 1.3.6.1.2.1.31.1.1.1.3.2 = "0" [ASN_COUNTER]
6/01/2017 11:33:19 AM (94 ms) : 1.3.6.1.2.1.31.1.1.1.3.3 = "0" [ASN_COUNTER]
6/01/2017 11:33:19 AM (100 ms) : 1.3.6.1.2.1.31.1.1.1.3.4 = "0" [ASN_COUNTER]
6/01/2017 11:33:19 AM (105 ms) : 1.3.6.1.2.1.31.1.1.1.3.5 = "0" [ASN_COUNTER]
6/01/2017 11:33:19 AM (111 ms) : 1.3.6.1.2.1.31.1.1.1.4.1 = "0" [ASN_COUNTER]
6/01/2017 11:33:19 AM (124 ms) : 1.3.6.1.2.1.31.1.1.1.4.2 = "0" [ASN_COUNTER]
6/01/2017 11:33:19 AM (130 ms) : 1.3.6.1.2.1.31.1.1.1.4.3 = "0" [ASN_COUNTER]
6/01/2017 11:33:19 AM (135 ms) : 1.3.6.1.2.1.31.1.1.1.4.4 = "0" [ASN_COUNTER]
6/01/2017 11:33:19 AM (141 ms) : 1.3.6.1.2.1.31.1.1.1.4.5 = "0" [ASN_COUNTER]
6/01/2017 11:33:19 AM (146 ms) : 1.3.6.1.2.1.31.1.1.1.5.1 = "0" [ASN_COUNTER]
6/01/2017 11:33:19 AM (151 ms) : 1.3.6.1.2.1.31.1.1.1.5.2 = "0" [ASN_COUNTER]
6/01/2017 11:33:19 AM (157 ms) : 1.3.6.1.2.1.31.1.1.1.5.3 = "0" [ASN_COUNTER]
6/01/2017 11:33:19 AM (163 ms) : 1.3.6.1.2.1.31.1.1.1.5.4 = "0" [ASN_COUNTER]
6/01/2017 11:33:19 AM (168 ms) : 1.3.6.1.2.1.31.1.1.1.5.5 = "0" [ASN_COUNTER]
6/01/2017 11:33:19 AM (174 ms) : 1.3.6.1.2.1.31.1.1.1.6.1 = "889736836" [ASN_APP_COUNTER64]
6/01/2017 11:33:19 AM (179 ms) : 1.3.6.1.2.1.31.1.1.1.6.2 = "1010882881" [ASN_APP_COUNTER64]
6/01/2017 11:33:19 AM (185 ms) : 1.3.6.1.2.1.31.1.1.1.6.3 = "3299068148" [ASN_APP_COUNTER64]
6/01/2017 11:33:19 AM (190 ms) : 1.3.6.1.2.1.31.1.1.1.6.4 = "699137718" [ASN_APP_COUNTER64]
6/01/2017 11:33:19 AM (195 ms) : 1.3.6.1.2.1.31.1.1.1.6.5 = "0" [ASN_APP_COUNTER64]
6/01/2017 11:33:19 AM (201 ms) : 1.3.6.1.2.1.31.1.1.1.7.1 = "1662501441" [ASN_APP_COUNTER64]
6/01/2017 11:33:19 AM (206 ms) : 1.3.6.1.2.1.31.1.1.1.7.2 = "1669497149" [ASN_APP_COUNTER64]
6/01/2017 11:33:19 AM (211 ms) : 1.3.6.1.2.1.31.1.1.1.7.3 = "435808021" [ASN_APP_COUNTER64]
6/01/2017 11:33:19 AM (217 ms) : 1.3.6.1.2.1.31.1.1.1.7.4 = "52564395" [ASN_APP_COUNTER64]
6/01/2017 11:33:19 AM (222 ms) : 1.3.6.1.2.1.31.1.1.1.7.5 = "0" [ASN_APP_COUNTER64]
6/01/2017 11:33:19 AM (228 ms) : 1.3.6.1.2.1.31.1.1.1.8.1 = "0" [ASN_APP_COUNTER64]
6/01/2017 11:33:19 AM (233 ms) : 1.3.6.1.2.1.31.1.1.1.8.2 = "0" [ASN_APP_COUNTER64]
6/01/2017 11:33:19 AM (238 ms) : 1.3.6.1.2.1.31.1.1.1.8.3 = "0" [ASN_APP_COUNTER64]
6/01/2017 11:33:19 AM (244 ms) : 1.3.6.1.2.1.31.1.1.1.8.4 = "0" [ASN_APP_COUNTER64]
6/01/2017 11:33:19 AM (249 ms) : 1.3.6.1.2.1.31.1.1.1.8.5 = "0" [ASN_APP_COUNTER64]
6/01/2017 11:33:19 AM (254 ms) : 1.3.6.1.2.1.31.1.1.1.9.1 = "0" [ASN_APP_COUNTER64]
6/01/2017 11:33:19 AM (260 ms) : 1.3.6.1.2.1.31.1.1.1.9.2 = "0" [ASN_APP_COUNTER64]
6/01/2017 11:33:19 AM (266 ms) : 1.3.6.1.2.1.31.1.1.1.9.3 = "0" [ASN_APP_COUNTER64]
6/01/2017 11:33:19 AM (272 ms) : 1.3.6.1.2.1.31.1.1.1.9.4 = "0" [ASN_APP_COUNTER64]
6/01/2017 11:33:19 AM (278 ms) : 1.3.6.1.2.1.31.1.1.1.9.5 = "0" [ASN_APP_COUNTER64]
6/01/2017 11:33:19 AM (283 ms) : 1.3.6.1.2.1.31.1.1.1.10.1 = "1511953446" [ASN_APP_COUNTER64]
6/01/2017 11:33:19 AM (289 ms) : 1.3.6.1.2.1.31.1.1.1.10.2 = "1229341275" [ASN_APP_COUNTER64]
6/01/2017 11:33:19 AM (294 ms) : 1.3.6.1.2.1.31.1.1.1.10.3 = "1176962037" [ASN_APP_COUNTER64]
6/01/2017 11:33:19 AM (300 ms) : 1.3.6.1.2.1.31.1.1.1.10.4 = "341967017" [ASN_APP_COUNTER64]
6/01/2017 11:33:19 AM (306 ms) : 1.3.6.1.2.1.31.1.1.1.10.5 = "0" [ASN_APP_COUNTER64]
6/01/2017 11:33:19 AM (311 ms) : 1.3.6.1.2.1.31.1.1.1.11.1 = "1503590644" [ASN_APP_COUNTER64]
6/01/2017 11:33:19 AM (317 ms) : 1.3.6.1.2.1.31.1.1.1.11.2 = "1815701821" [ASN_APP_COUNTER64]
6/01/2017 11:33:19 AM (322 ms) : 1.3.6.1.2.1.31.1.1.1.11.3 = "597273046" [ASN_APP_COUNTER64]
6/01/2017 11:33:19 AM (328 ms) : 1.3.6.1.2.1.31.1.1.1.11.4 = "61536027" [ASN_APP_COUNTER64]
6/01/2017 11:33:19 AM (333 ms) : 1.3.6.1.2.1.31.1.1.1.11.5 = "0" [ASN_APP_COUNTER64]
6/01/2017 11:33:19 AM (339 ms) : 1.3.6.1.2.1.31.1.1.1.12.1 = "0" [ASN_APP_COUNTER64]
6/01/2017 11:33:19 AM (344 ms) : 1.3.6.1.2.1.31.1.1.1.12.2 = "0" [ASN_APP_COUNTER64]
6/01/2017 11:33:19 AM (350 ms) : 1.3.6.1.2.1.31.1.1.1.12.3 = "0" [ASN_APP_COUNTER64]
6/01/2017 11:33:19 AM (355 ms) : 1.3.6.1.2.1.31.1.1.1.12.4 = "0" [ASN_APP_COUNTER64]
6/01/2017 11:33:19 AM (361 ms) : 1.3.6.1.2.1.31.1.1.1.12.5 = "0" [ASN_APP_COUNTER64]
6/01/2017 11:33:19 AM (367 ms) : 1.3.6.1.2.1.31.1.1.1.13.1 = "0" [ASN_APP_COUNTER64]
6/01/2017 11:33:19 AM (372 ms) : 1.3.6.1.2.1.31.1.1.1.13.2 = "0" [ASN_APP_COUNTER64]
6/01/2017 11:33:19 AM (378 ms) : 1.3.6.1.2.1.31.1.1.1.13.3 = "0" [ASN_APP_COUNTER64]
6/01/2017 11:33:19 AM (384 ms) : 1.3.6.1.2.1.31.1.1.1.13.4 = "0" [ASN_APP_COUNTER64]
6/01/2017 11:33:19 AM (390 ms) : 1.3.6.1.2.1.31.1.1.1.13.5 = "0" [ASN_APP_COUNTER64]
6/01/2017 11:33:19 AM (396 ms) : 1.3.6.1.2.1.31.1.1.1.15.1 = "100" [ASN_UNSIGNED]
6/01/2017 11:33:19 AM (402 ms) : 1.3.6.1.2.1.31.1.1.1.15.2 = "1000" [ASN_UNSIGNED]
6/01/2017 11:33:19 AM (407 ms) : 1.3.6.1.2.1.31.1.1.1.15.3 = "1000" [ASN_UNSIGNED]
6/01/2017 11:33:19 AM (413 ms) : 1.3.6.1.2.1.31.1.1.1.15.4 = "100" [ASN_UNSIGNED]
6/01/2017 11:33:19 AM (419 ms) : 1.3.6.1.2.1.31.1.1.1.15.5 = "10" [ASN_UNSIGNED]
6/01/2017 11:33:19 AM (426 ms) : 1.3.6.1.2.1.31.1.1.1.18.1 = "" [ASN_OCTET_STR]
6/01/2017 11:33:19 AM (432 ms) : 1.3.6.1.2.1.31.1.1.1.18.2 = "" [ASN_OCTET_STR]
6/01/2017 11:33:19 AM (437 ms) : 1.3.6.1.2.1.31.1.1.1.18.3 = "" [ASN_OCTET_STR]
6/01/2017 11:33:19 AM (443 ms) : 1.3.6.1.2.1.31.1.1.1.18.4 = "" [ASN_OCTET_STR]
6/01/2017 11:33:19 AM (449 ms) : 1.3.6.1.2.1.31.1.1.1.18.5 = "" [ASN_OCTET_STR

If I walk 1.3.6.1.4.1.29671.1.1.4 (devTable) however, all I get is this:

Paessler SNMP Tester 5.2.3 Computername:  PC Interface: (192.168.1.2)
6/01/2017 11:33:25 AM (11 ms) : Device: 192.168.1.1
6/01/2017 11:33:25 AM (16 ms) : SNMP V2c
6/01/2017 11:33:25 AM (21 ms) : Walk 1.3.6.1.4.1.29671.1.1.4

Any ideas?

Created on Jan 6, 2017 12:50:35 AM

Last change on Jan 6, 2017 1:50:19 PM by  Luciano Lingnau [Paessler]


Votes:

0

Hello "Dunc the Punk", thank you for your input.

I've uncovered an issue with the Check ID: snmp; routine, which caused it to fail quite often. I will be uploading a v.02 of the script very soon (I'll replace the contents of the download link above). The new version should address this. Since this will depend on a CDN update, please try downloading the device template/zip file again in the next 24 hours and try again.
Please let me know the outcome. Please let me know the output from the discovery log then.

Best Regards,
Luciano Lingnau [Paessler Support]

Created on Jan 9, 2017 12:58:55 PM by  Luciano Lingnau [Paessler]


Votes:

0

Thanks for getting this setup. It would be nice if Meraki supported the RFC for SNMP correctly. I am having the same issue as Dunc, I can walk 1.3.6.1.2.1.31.1.1 but not 1.3.6.1.4.1.29671.1.1.4 (MX64 firewall). Testing on some wireless APs now.

4/4/2017 10:27:14 AM: Template Loaded; Device ID: 13583; Name: Custom Meraki
4/4/2017 10:27:19 AM: Template Check; Device ID: 13583; Check ID: ping; FOUND
4/4/2017 10:27:20 AM: Template Check; Device ID: 13583; Check ID: snmp_system; FOUND
4/4/2017 10:27:21 AM: Template Check; Device ID: 13583; Check ID: snmp_devTable; NOT FOUND
4/4/2017 10:27:22 AM: Template Check; Device ID: 13583; Check ID: snmp_ifXTable; FOUND
4/4/2017 10:27:22 AM: Template Assigned; Device ID: 13583; Name: Custom Meraki
4/4/2017 10:27:23 AM: Template Create Meta Request; Device ID: 13583; Create ID: _snmptable1.3.6.1.2.1.31.1.1.1.1; FOUND: 5
4/4/2017 10:27:23 AM: Sensor Created; Device ID: 13583; Create ID: _snmptable1.3.6.1.2.1.31.1.1.1.1; Sensor ID: 13585; Name: SNMP Traffic Custom / wan1
4/4/2017 10:27:23 AM: Sensor Created; Device ID: 13583; Create ID: _snmptable1.3.6.1.2.1.31.1.1.1.1; Sensor ID: 13586; Name: SNMP Traffic Custom / lan1
4/4/2017 10:27:23 AM: Sensor Created; Device ID: 13583; Create ID: _snmptable1.3.6.1.2.1.31.1.1.1.1; Sensor ID: 13587; Name: SNMP Traffic Custom / lan2
4/4/2017 10:27:23 AM: Sensor Created; Device ID: 13583; Create ID: _snmptable1.3.6.1.2.1.31.1.1.1.1; Sensor ID: 13588; Name: SNMP Traffic Custom / lan3
4/4/2017 10:27:23 AM: Sensor Created; Device ID: 13583; Create ID: _snmptable1.3.6.1.2.1.31.1.1.1.1; Sensor ID: 13589; Name: SNMP Traffic Custom / lan4
4/4/2017 10:27:25 AM: Autodiscovery Finished: Device ID: 13583; Sensor(s): 5; Templates: Custom Meraki

Created on Apr 4, 2017 2:35:49 PM


Votes:

0

Actually I spoke too soon, even though I can't walk that second OID it still created the sensors for my MX64. Thanks again!

Created on Apr 4, 2017 2:37:20 PM


Votes:

0

Hi Team,

I have this up an running against 3 MX65W's and have one question.

The standard check interval is 30sec and in quite a few of the check we get zeros for the result - this happens on all 3 of the MX65's. Any ideas?

There is no loss of service, no lag / latency on pings. Two of the units are remote via the Auto-VPN feature and the other is local to my LAN. It also isn't dependent on speed or volume of the links as this happens with very little load and huge data transfers.

I have uploaded a pic to ImgBB

https://ibb.co/eHK1VG

Regard,

LC

Created on Dec 11, 2017 11:04:25 PM


Votes:

0

Hi there,

This is normal as the device most likely doesn't update its SNMP Counter that often. So when the device updates the counters only every 50 seconds, but you query them every 30 seconds, then you will receive 0-values as the counters were twice the same. Please increase the scanning interval to at least 60 seconds and it should work again.

Best regards.

Created on Dec 12, 2017 12:13:24 PM by  Dariusz Gorka [Paessler Support]


Votes:

0

I am trying to do this for my MX84. I ran the autodiscovery with template and it found ping and http. But did not find the SNMP. I verified that snmp works with snmpwalk from command line on my computer. Not sure what I can do next to help troubleshoot the issue.

Created on Jan 24, 2018 3:32:11 PM


Votes:

0

Hello there,

Please check the "It's possible to troubleshoot the auto-discovery by inspecting the auto-discovery log, if you get entries like the one below ( NOT FOUND) it means that the required OID's aren't available." section of the guide, it provides instructions to check what happened during the auto-discovery.

Also, please deploy an "SNMP Custom String" on the following OID in PRTG (on the MX84). What result do you get?

1.3.6.1.2.1.31.1.1.1.1.1

Best Regards,
Luciano Lingnau [Paessler Support]

Created on Jan 26, 2018 2:29:27 PM by  Luciano Lingnau [Paessler]


Votes:

0

Running PRTG 18.1.38.11934. Followed the directions here and still cannot get bandwidth monitoring set up on my MX64. The custom auto-discovery shows up in there, but never get any sensors set up.

Has anyone successfully set up bandwidth monitoring on a Meraki MX64 with PRTG?

Created on Mar 27, 2018 12:38:52 AM


Votes:

0

Hello mvalpreda,

Please forward us your Auto-Discovery log, it may tell us more about what went wrong. You'll locate the Auto-Discovery log on the following default path:

C:\ProgramData\Paessler\PRTG Network Monitor\Logs (System)

Thank you in advance.
Sebastian

Created on Mar 29, 2018 9:45:24 AM by  Sebastian Kniege [Paessler Support]


Votes:

0

Hi.

I have two network groups that contain Meraki wireless devices. Each on different probes/sites. They have been auto-discovered, and both groups returned a device IP and green PING sensors only for every device it reached. My goal is to have each Meraki device show SNMP traffic. I have the IF-MIB.my in my MIB folder, and 'custom Meraki.odt' in devicetemplates folder. When I run auto-discovery with template on the entire group, select template 'custom Meraki.odt' the auto discovery logs shows PING failures (ERROR 106) for each device it can't PING. It seems to skip the devices it can PING successful (10.3.23.21-10.3.23.30 in the example below) , while never adding the SNMP traffic sensors:

10/3/2018 8:07:57 AM: Ping Check; Group ID: 43353; IP: 10.3.23.20; ERROR: 106
10/3/2018 8:08:01 AM: Ping Check; Group ID: 43353; IP: 10.3.23.31; ERROR: 106

However, if I do an autodiscovery on one device in the same group using the same template, it discovers the sensors fine with no problem:

10/3/2018 8:29:46 AM: Autodiscovery Started; Device ID: 43362
10/3/2018 8:29:46 AM: Device ID: 43362 Name: 10.3.23.28 Host: 10.3.23.28
10/3/2018 8:29:46 AM: Device Templates; Device ID: 43362; Selected: 1
10/3/2018 8:29:47 AM: Template Loaded; Device ID: 43362; Name: Custom Meraki
10/3/2018 8:29:47 AM: Template Check; Device ID: 43362; Check ID: ping; FOUND
10/3/2018 8:29:48 AM: Template Check; Device ID: 43362; Check ID: snmp_system; FOUND
10/3/2018 8:29:49 AM: Template Check; Device ID: 43362; Check ID: snmp_devTable; NOT FOUND
10/3/2018 8:29:50 AM: Template Check; Device ID: 43362; Check ID: snmp_ifXTable; FOUND
10/3/2018 8:29:50 AM: Template Assigned; Device ID: 43362; Name: Custom Meraki
10/3/2018 8:29:51 AM: Template Create Meta Request; Device ID: 43362; Create ID: _snmptable1.3.6.1.2.1.31.1.1.1.1; FOUND: 3
10/3/2018 8:29:53 AM: Sensor Created; Device ID: 43362; Create ID: _snmptable1.3.6.1.2.1.31.1.1.1.1; Sensor ID: 43622; Name: SNMP Traffic Custom / wired0
10/3/2018 8:29:58 AM: Sensor Created; Device ID: 43362; Create ID: _snmptable1.3.6.1.2.1.31.1.1.1.1; Sensor ID: 43623; Name: SNMP Traffic Custom / apr0
10/3/2018 8:29:59 AM: Sensor Created; Device ID: 43362; Create ID: _snmptable1.3.6.1.2.1.31.1.1.1.1; Sensor ID: 43624; Name: SNMP Traffic Custom / apr1
10/3/2018 8:30:17 AM: Autodiscovery Finished: Device ID: 43362; Sensor(s): 3; Templates: Custom Meraki

Please help me troubleshoot why I can not successfully autodiscover by group. I can send you my full auto-discovery log if needed.

Sincerely,
Nick Daniello

Created on Oct 3, 2018 12:34:13 PM

Last change on Oct 3, 2018 1:11:51 PM by  Dariusz Gorka [Paessler Support]


Votes:

0

Hi,

Hoping for some assistance, as not sure how up to date info in here is, given most recent post is from 2018.

I'm trying to get our Meraki devices in PRTG, but when I use OIDlib that I've created from the Meraki MIB using the converter tool, it all works OK, but the name of all the devices it returns to me in PRTG are all weird symbols, so I can't actually work out what device is what.

Here's an example of the results I'm getting:

dev:  oü½/dev status

dev:  {ò_/dev product description

etc...

Created on Jan 10, 2022 2:50:43 PM


Votes:

0

Hello,

For testing purposes, you can use our SNMP Tester and perform a Walk using the following OIDs:
- 1.3.6.1.2.1.31.1.1 (ifXTable)
- 1.3.6.1.4.1.29671.1.1.4 (devTable)

Here we should see the actual device names returned by SNMP. If you need further assistance and want us to take a closer look, feel free to send us those results as well as screenshots of the issue to [email protected]

Created on Jan 11, 2022 6:07:47 AM by  Timo Dambach [Paessler Support]


Votes:

0

Hi Timo,

I've spoken to yourselves via email, although not you personally, hoping you might be able to assist, or anyone else in the community.

When I try to walk using SNMP Tester, it doesn't progress beyond the initial connection, results below:

----------------------- New Test -----------------------
Paessler SNMP Tester - 20.2.4 Computername: RETAIL-DC01 Interface: (192.168.1.5)
13/01/2022 12:49:18 (2 ms) : Device: snmp.meraki.com
13/01/2022 12:49:18 (7 ms) : SNMP v2c
13/01/2022 12:49:18 (12 ms) : Walk 1.3.6.1.2.1.31.1.1

It stops at that last line.

Email support advised me to use the "scan interfaces" option, but this returns:

Found standard interfaces: No standard interfaces found

Plenty of others have this working in some capacity, so I must be doing something wrong?

Created on Jan 13, 2022 12:50:15 PM

Last change on Jan 13, 2022 1:59:44 PM by  Timo Dambach [Paessler Support]


Votes:

0

Hello,
If you do not get any SNMP response, either SNMP is not configured correctly or the device does not support those OIDs. Its also possible that a firmware update solves this issues.
In any case, the device vendor might be able to give you further information on this.

Created on Jan 13, 2022 2:04:33 PM by  Timo Dambach [Paessler Support]


Votes:

0

Created on Jan 19, 2022 11:28:09 AM

Last change on Jan 19, 2022 2:46:49 PM by  Timo Dambach [Paessler Support]


Votes:

0

Feel free to propose a new official feature request (with the values you are looking to monitor) if you wish a corresponding native sensor to be implemented in the future. This will help us to prioritise the wish internally (based on the number of votes) so that the feature eventually makes its way into the roadmap then.

Created on Jan 19, 2022 2:46:32 PM by  Timo Dambach [Paessler Support]


Disclaimer: The information in the Paessler Knowledge Base comes without warranty of any kind. Use at your own risk. Before applying any instructions please exercise proper system administrator housekeeping. You must make sure that a proper backup of all your data is available.